
Cereal and soya bean production and food security in China: Challenges and opportunities
Introduction
China’s GDP has increased steadily since 1949, reaching 63,646 billion Renminbi (1038 billion US dollars) in 2014 to become the world’s second largest economy (1) (Fig. 1).
In recent years, China’s food security has received attention from researchers and policy makers (2, 3). In 2011, China had 20% of global food production (4). Future trends in grain production, consumption and import will affect food prices in the region (5) and food security is a high priority of China’s national political agenda.
Increasing grain production to ensure food security is a national priority (6). In this paper we include soya bean as a grain crop, so that the term ‘grain crops’ includes all cereals and soya.
China’s grain production doubled from 300 Mt in 1949 to 600 Mt in 2014 (7), China produces 80% of its food on irrigated farmland (8). In the last two decades, the availability of water (surface water and groundwater) has declined and may become deficient for agricultural purposes in the next 20 years (9).
China’s population is projected to grow by 60 million from 2010 to 2025 (10). With the water crisis in North China, overall grain production and hence food security in China will be challenged.
The grain (cereals and soybean) production in North and South China has changed with the economic growth of South China (11). Our primary goal here is to review changes in grain productivity in China and assess challenges for national food security.
This review covers:
(1) Grain productivity patterns on a geographical basis;
(2) The history of ‘South shipped food to North’ policy, the effect of the economic reform programme on grain production in South China, and the reasons for its decline;
(3) Trends in grain production in North China, and the contribution of irrigation to grain yield:
(4) an assessment of the ‘North shipped food to South’ policy, and how the current policies of the Central Government will further deepen the water shortages in North China.
Geographical grain production patterns
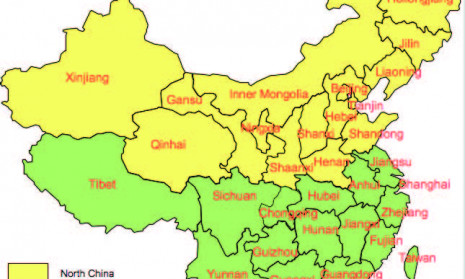
China’s agricultural production areas are divided into North China and South China by the Qinling Mountains and Huai River (12).
North China consists of arid and semi-arid regions with suitable thermal conditions for grain production in spring and summer.
However, it lacks water resources with only 18% of the total available water in China despite having 65% of the total arable land (10).
North China consists of 16 provinces, while South China consists of 19 provinces: (Fig. 2; data from Hong Kong, Macau and Taiwan not included). The main crops grown in North China are wheat and maize, while South China with its humid climate, relative abundance of water and summer rainfall which is often ‘wasted’ through flooding (13), grows mainly rice.
The reversal of grain production capacity in North China and South China
South China historically produces higher yields and more grain than North China, due to its higher rainfall and temperatures, so the Sui Grande Canal was built during the Sui Dynasty.
Subsequent improvements to the engineering of the Canal ensured that grain transportation was unimpeded (11).
From 1949 to 2005, grain production was higher in the south than the north and both increased in parallel from 1949 until 1980 (Fig. 3).
From 1980, grain production in the south stagnated, while production in the north continued to increase so that from 2005 grain production in the north exceeded that in the south (Fig. 3). Grain production in South China was 278kg/capita from 1949 to 1985, compared with 303kg, in North China. Owing to net migration and stagnation of grain production, the grain production per capita continued to increase in North China, (Fig. 4a), so that grain production per capita for North and South China from 1985 to 2013 were 447kg and 344kg respectively. Under the traditional planned economic system (20), the government unified the purchase and sale of food, regulating its allocation to different provinces, resulting in an average of more than 6.42 Mt per year being transported from South China to North China from 1949 to 1989 (Fig. 4).
The GDP of South China relative to the GDP of the whole country increased from 53.7% in 1978 to 57.4% in 2013 (Fig. 5). Since 1985 when the Chinese government cancelled the state monopoly for purchasing and marketing agricultural products (30, 21), non-agricultural industries have benefited more than agricultural industries due to low profit margins in traditional agriculture. Development of a rural township enterprise in the southeast coastal region has been rapid, with the agricultural labor force moving to non-agricultural industries. For example, in Guangdong province, the share of non-farming income for rural residents increased from 44% in 2002 to 65% in 2012 (data from the National Statistical Bureau of China website). Farmers paid less attention to their land and the cropping intensity (number of crops harvested per unit area per year) decreased significantly from 164% in 1979 to 94% in 2009 (Fig. 6a). The area under crops in 2013 was 9.9 Mha less than that in 1978 (Fig. 6b).
Grain production in South China increased from 67.60 Mt in 1949 to 262.72 Mt in 2013 (Fig.3a). Before 2005, South China accounted for more than half of the country’s grain production but this decreased from 62% in 1982 to 44% in 2013 (Fig. 3b). From 1978 to 2013, the percentage share of grain production in China for Jiangxi and Anhui provinces increased slightly, Tibet remained stable, while in the remaining provinces of South China it decreased, especially in Zhejiang and Guangdong (Fig.7a).
Increasing grain production in North China
Grain producing areas in North China are located in a dry climate zone with abundant sunlight, but with less precipitation and cooler temperatures than South China. Due to the shortage of water resources in this area, productivity has been below the potential of the land quality.
To overcome this, the Chinese government developed irrigation and water conservation facilities, such as dams, reservoirs and wells, to intercept surface water and pump groundwater (33). The area of irrigated farmland has been expanded by 59.5% since 1978 to reach an area of 35.1 Mha in 2013 (Fig. 8) and is the major reason the north ships food south today. From 1978 to 2013, there was a significant positive relationship between the area of irrigated farmland and the percentage share of the total Chinese grain yield in North China (P<0.001, n=36).
Production in North China increased from 125.28 Mt in 1978 to 339.22 Mt in 2013, with the proportional share of Chinese production increasing from 41.1% to 56.4% (Fig 3b).
Economic development in North China does not appear to have affected grain production; this may be because most provinces in North China are less developed than in the South.
Nine provinces increased their proportional share from 1978 to 2013: Hebei, Mongolia, Jilin, Heilongjiang, Shandong, Henan, Gansu, Ningxia, Xinjiang, with Heilongjiang increasing the most (5.3%). The proportional share of five provinces decreased: Beijing, Tianjin, Liaoning, Shaanxi and Qinghai, while that of Shanxi remained stable (Fig. 7a).
Output in North China increased from 310 kg/capita in 1978 to 595 kg in 2013. Total surplus grain for export in North China increased from 13.27 Mt in 1990 to 55.68 Mt in 2013 (Fig. 4b) with eight provinces exporting grain (Fig. 7b).
The increased total grain production in North China mainly resulted from increased yield per unit area rather than any increase in cultivated area (Figs 9a, 9b). In 2013, yield per unit area in North China reached 5.4 t ha–1 (Fig. 6a).
‘North shipped food to South’ and its unsustainability
South China has had a continuous grain shortage since 1990, with the gap widening each year.
Consumption exceeded production by 128 Mt in 2013 (Fig. 4b), with only the Anhui province producing surplus grain (Fig. 7b). Grain production in South China fell from 401 kg/capita in 1984 to 335 kg in 2013 (Fig. 4a).
Confronted with the large grain shortage in South China, the Chinese government could have bought grain through the international market, but this will require a change in government policy. Transport of grain from North China to South China is not regarded as sustainable as the production uses large amounts of surface – and ground-water.
The average quantity of grain transported from North China to South China from 1990 to 2012 was more than 30.20 Mt per year (Fig. 4b), reaching 55.68 Mt in 2013.
One ton of grain requires 1,000 t of water, equating to the 55.7 Gt of water. Groundwater is used to irrigate more than 40% of China’s farmland (34), which has lowered the water table,
particularly on the North China Plain (34–36). In addition, some natural oases along the old Silk Road have shrunk or disappeared, wells have dried up, and water flow in the Yellow, Huai and Songhua Rivers has decreased (37). The use of water for irrigation has significantly compromised the availability of water resources for ecological sustainability (38).
In an attempt to ease the water shortages in North China, a ‘South–North Water Transfer Project’ Scheme was initiated in 2002—the world’s longest and largest water diversion project with a planned investment of 486 billion Renminbi (U.S. $77 billion) (39). Based on the current 1000 tons of water needed to produce one ton of grain, farmers cannot afford to buy water in the absence of state subsidies.
An estimated annual total of 44.8 Gt of water by 2050 (39) will be moved in the ‘South–North Water Transfer’ far less than the 55.7 Gt of water used for grain production in North China in 2013. Therefore, it is not a feasible plan to produce grain in the North using water from South China.
Achieving sustainable food security
It is difficult to improve agricultural water use efficiency in China in the short term.
At present, the central government vigorously promotes grain production to ensure food security, but at the same time needs to control water use. With its water and temperature advantages, South China is the inevitable choice for increasing grain production.
In 2009, the cropping intensity in South China was about 94%, compared with 164% in 1979 (Fig. 6a), there is potential to improve cropping intensity and hence production per unit area. The Government should encourage farmers to increase crop production and efficiency by providing appropriate farming subsidies.
At the same time, the Chinese government should reduce the number of small and non-viable farms and consolidate land into larger units to increase efficiency and farmer income, especially in areas where a comparative advantage exists.
In addition, North China should reduce its total water consumption by industry and increase agricultural water use efficiency. This may be best achieved by increasing yield through modern crop breeding technologies, innovative farming systems and other emerging technologies (40).
Water-saving measures in agriculture that could be implemented include drip and sprinkler irrigation, no-till farming to reduce evaporation and ridge– furrow mulching systems to increase precipitation use efficiency (41–44) (Fig. 10).
Conclusion and future outlook
The Chinese government is currently implementing the ‘One Belt and One Road’ policy to develop the economy (45).
Chinese government is also vigorously promoting grain production to ensure national food security, but has not reduced the consumption of surface- or ground-water in North China.
This will further aggravate the water crisis in that region (37). Urgent attention is needed to alleviate the pressure on water resources to replenish the deep aquifers in North China and to increase grain production from the current levels in South China.
Most provinces in West and North China are self-sufficient in grain production but, in the face of future economic development, some provinces may move away from investment in agriculture and grain production. The government should strategically allocate grain production targets to all provinces based on their water and environmental resource to guide future food production of China.
Acknowledgements
This work was supported by the Chinese National Key Technology Support Program (2015BAD22B03); the Fundamental Research Funds for the Central Universities of China (2452016015).
References
1. National Statistical Bureau of China, (2014) China Statistical Yearbook 2014. China Statistics Press, Beijing.
2. Khan, S, Hanjra, M A. & Mu, J X (2009) Water management and crop production for food security in China: A review. Agricultural Water Management, 96, 349-360.
3. Machlis, G E (2015) China addresses food and environment security. Science, 347(6224), 836.
4. http://faostat3.fao.org/compare/E. 11.16.2016
5. World Bank, China 2020: Development challenges in the new century [M]1 Washington D C: World Bank, 1997. pp. 61-691.
6. National 1st policy document of China. (2015) On accelerating reform and innovation to speed up the construction of agricultural modernization. Xinhua News. 2015.02.01. http://www.sh.xinhuanet.com/2015-02/02/c_133964284.htm
7. http://202.127.42.157/moazzys/nongqing_result.aspx?ye ar=2016, 2015, 2014, 2013, 2012, 2011, 2010, 2009, 2008, 2007, 2006, 2005, 2004, 2003, 2002, 2001, 2000, 1999, 1998, 1997, 1996, 1995, 1994, 1993, 1992, 1991, 1990, 1989, 1988, 1987, 1986, 1985, 1984, 1983, 1982, 1981, 1980, 1979, 1978, 1977, 1976, 1975, 1974, 1973, 1972, 1971, 1970, 1969, 1968, 1967, 1966, 1965, 1964, 1963, 1962, 1961, 1960, 1959, 1958, 1957, 1956, 1955, 1954, 1953, 1952, 1951,1950,1949&prov=00%2%20%20&item=02&type=2&radio=1&order1=year_code&order2=prov_code&order3=item_code 11.16.2016
8. Zhang, G H, Shen, J M, Zhang, C Y & Liu, S Y (2006) Characteristic of variations of surface runoff and groundwater recharge in the middle Heihe River Valley, northwestern Gansu, China. Geology Bulletin China, 25, 251-255.
9. Liu, Y H (2006) The Chinese ministry of science and technology of rural and social development division. In: The Development Strategies on Water-saving Agriculture in China. Chinese Agriculture Science Technology Press, Beijing.
10. World Population Prospects: The 2010 Revision (UN DESA, New York, 2010); http://esa.un. org/wpp/documentation/WPP%202010%20publications.htm
11. Wang, L X & Liao, Y C (2013) Improvement and strategic reserve of grain production capacity of China. Yang Guang Publishing Press.
12. Almond, D, Chen, Y, Greenstone, M & Li H. (2009) Winter heating or clean air? unintended impacts of China’s Huai river policy. American Economic Review 99(2), 184-190.
13. Piao, S L, Ciais, P, Huang, Y, Shen, Z H, Peng, S S, Li, J S, Zhou, L P, Liu, H Y, Ma, Y C, Ding, Y H, Friedlingstein, P, Liu, C Z, Tan, K, Yu, Y Q, Zhang, T Y & Fang, JY (2010) The impacts of climate change on water resources and agriculture in China. Nature, 467 (2), 43-51.
14. Ministry of Agriculture of China, (2009a) Agricultural statistical data of 60 years in new China, China Agriculture Press, Beijing.
15. Ministry of Agriculture of China, (2009b) China Agricultural Statistical Data 2009, China Agriculture Press, Beijing.
16. Ministry of Agriculture of China, (2010) China Agricultural Statistical Data 2010, China Agriculture Press, Beijing.
17. Ministry of Agriculture of China, (2011) China Agricultural Statistical Data 2011, China Agriculture Press, Beijing.
18. Ministry of Agriculture of China, (2012) China Agricultural Statistical Data 2012, China Agriculture Press, Beijing.
19. Ministry of Agriculture of China, (2013) China Agricultural Statistical Data 2013, China Agriculture Press, Beijing.
20. McMillan, J, & Naughton, B (1992) How to reform a planned economy: lessons from China. Oxford Review of Economic Policy, 8, 130-143.
21. Naughton, B (1995) Growing Out of the Plan: Chinese Economic Reform, 1978-1993, Cambridge University, Press.
22. National Statistical Bureau Rural Economic Investigation Department of China, (2009) Data Collection of Agricultural Statistical since the Reform and Opening up of 30 Years. China Statistical Publishing Press.
23. National Statistical Bureau of China, (2009a) 60 Years in New China. China Statistics Press, Beijing.
24. National Statistical Bureau of China, (2009b) China Statistical Yearbook 2009. China Statistics Press, Beijing.
25. National Statistical Bureau of China, (2010) China Statistical Yearbook 2010. China Statistics Press, Beijing.
26. National Statistical Bureau of China, (2011) China Statistical Yearbook 2011. China Statistics Press, Beijing.
27. National Statistical Bureau of China, (2012) China Statistical Yearbook 2012. China Statistics Press, Beijing.
28. National Statistical Bureau of China, (2013) China Statistical Yearbook 2013. China Statistics Press, Beijing.
29. Chai, J C H (1997) China: Transition to a market economy. Oxford: Clarendon.
30. National 1st policy document of China. (1985) Ten policies of CPC Central Committee and the State Council on further active rural economy. People’s Daily News. 1985.01.01. http://finance.people.com.cn/GB/8215/135583/8145899.html
31. Ministry of Land and Resources of Cadastre Management, (2005) Survey of the Reclamation of Land Use in China 2005, China Land Press.
32. Ministry of Land and Resources of Cadastre Management, (2009) Survey of the Reclamation of Land Use in China 2009, China Land Press.
33. Liu, J G & Yang, W (2012) Water sustainability for China and beyond. Science, 337, 649-650.
34. Qiu, J (2010) China faces up to groundwater crisis. Nature, 466, 3081.
35. Li, J G (2010) Water shortages loom as northern China’s aquifers are sucked dry. Science, 328, 1462-1463.
36. Feng, W, Zhong, M, Lemoine, J M, Biancale, R, Hsu, H T & Xia, J (2013) Evaluation of groundwater depletion in North China using the Gravity Recovery and Climate Experiment (GRACE) data and ground-based measurements. Water Resources Research, 49(4), 2110-2118.
37. Chai, Q, Gan, Y T, Turner, N C, Zhang, R Z, Yang, C, Niu, Y N & Siddique, K H M (2014) Water-saving innovations in Chinese agriculture. Advances in Agronomy, 126, 149-202.
38. Liu, J, Zang, C, Tian, S, Liu, J, Yang, H, Jia, S, You, L, Liu, B & Zhang, M (2013) Water conservancy projects in China: Achievements, challenges and way forward. Global Environmental Change, 23, 633-643.
39. Zhang, Q F (2009) The South to North Water Transfer Project of China: environmental implications and monitoring strategy. J. Am. Water Resour. As., 45: 1238-1247.
40. Huang, J, Rozelle, S & Pray, C (2002) Enhancing the crops to feed the poor. Nature, 418 (8), 678-684.
41. Gan, Y T, Siddique, K H M, Turner, N C, Li, XG, Niu, J Y, Yang, C, Liu, L P & Chai, Q (2013) Ridge–furrow mulching systems–An innovative technique for boosting crop productivity in semiarid rain-fed environments. Advances in Agronomy, 118, 429-476.
42. Liu, C A, Zhou, L M, Jia, J J, Si, J T, Li, X, Pan, C C, Siddique, K H M & Li, F M (2014) Maize yield and water balance is affected by nitrogen application in a film-mulching ridge–furrow system in a semiarid region of China. European Journal of Agronomy, 52, 103-111.
43. Wang, X H, Lu, W X, Xu, Y J, Zhang, G X, Qu W. & Cheng, W G (2016) The positive impacts of irrigation schedules on rice yield and water consumption: synergies in Jilin Province, Northeast China. International Journal of Agricultural Sustainability, 14, 1-12.
44. News from Xinhua, 2015. http://www.gs.xinhuanet.com/news/201508/12/c_1116225256.htm
45. Ze, S (2014) One Road one Belt “& New thinking with regard with concepts and practice, The International Schiller Institute.
Download pdfFigures
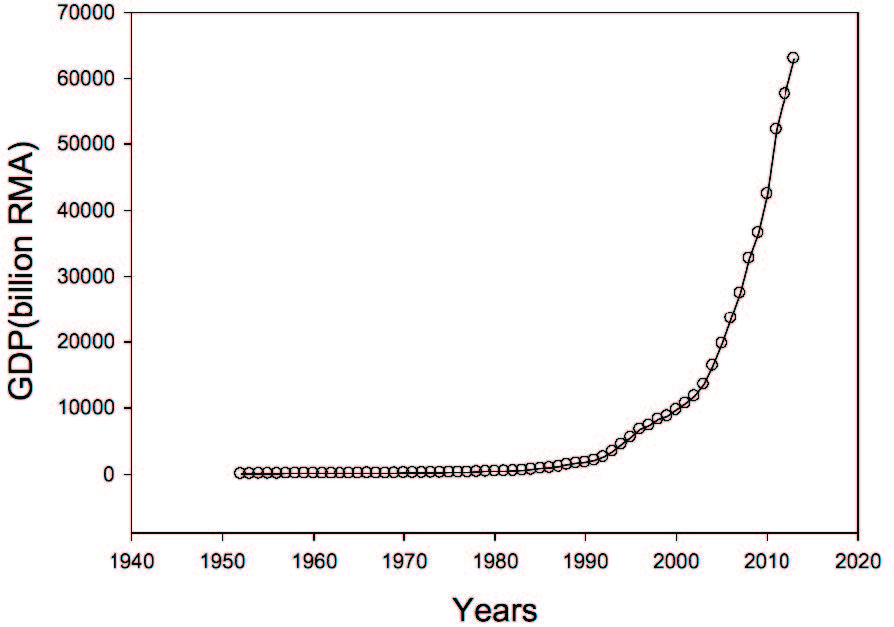
Figure 1. The increasing trend of China’s GDP from 1949 to 2013.
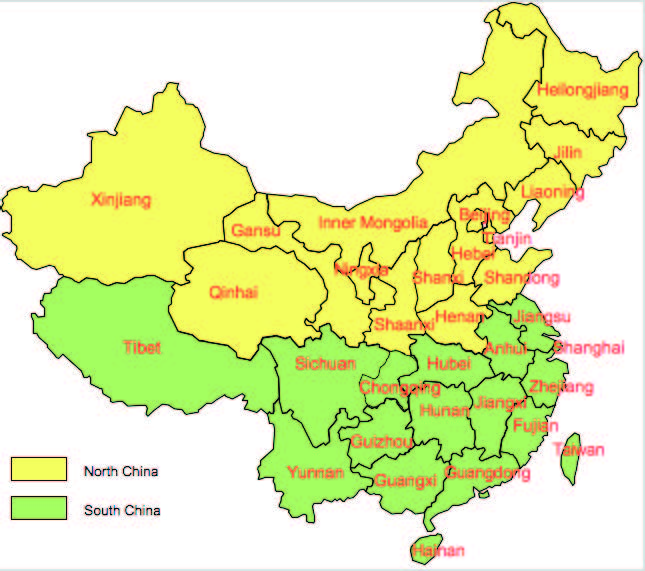
Figure 2. Provinces of North China and South China.
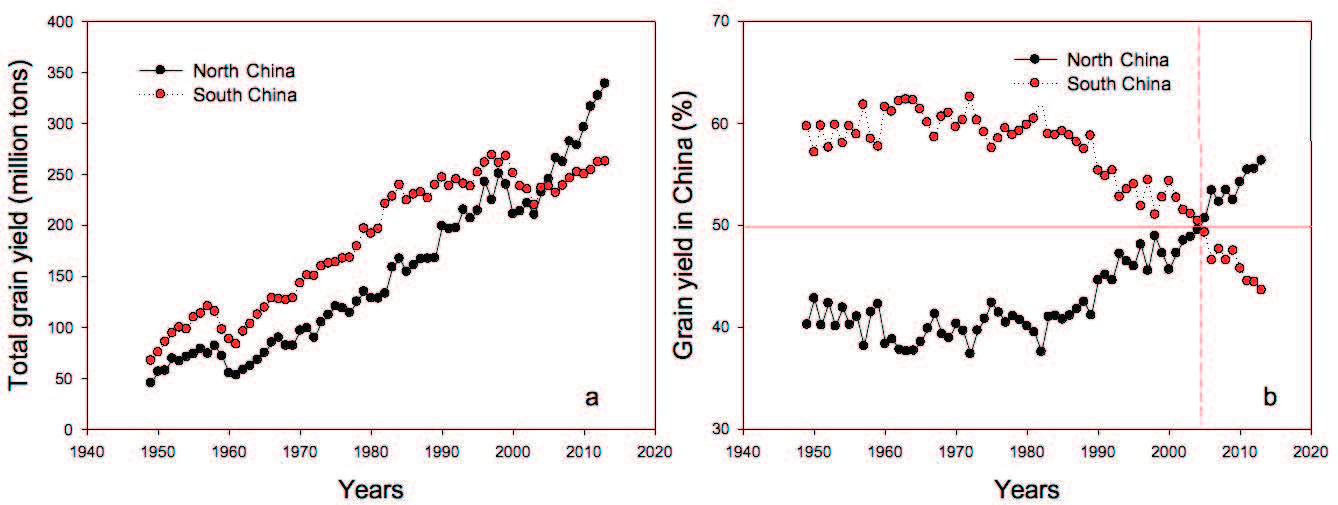
Fig. 3. (a) Total grain production and (b) change in percentage share of grain yield in North China and South China over time (Ministry of Agriculture of China website: http://www.moa.gov.cn/)
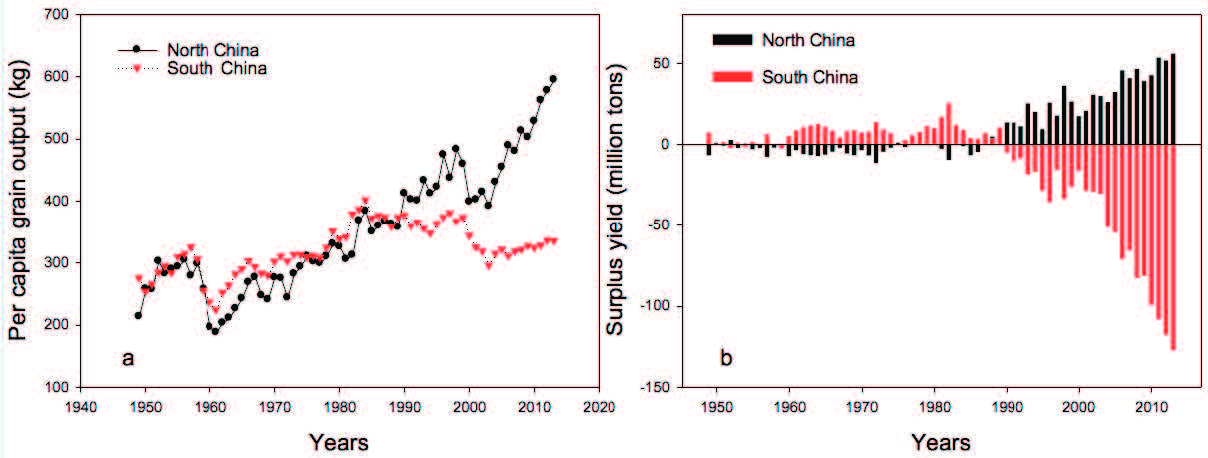
Figure 4 (a) Change in per capita grain output and (b) amount of surplus grain from 1949 to 2013 in North China and South China, Negative surplus yield implies grain shortage (14–19, National Bureau of Statistics website:
http://data.stats.gov.cn/english/).
Calculations: Surplus grain = (grain yield per capita in a region) – (per capita grain consumption in China) Å~ population in the region. Per capita grain consumption in China = (grain output – exports + imports) / total population in China. Per capita grain output = (grain output) / total population.
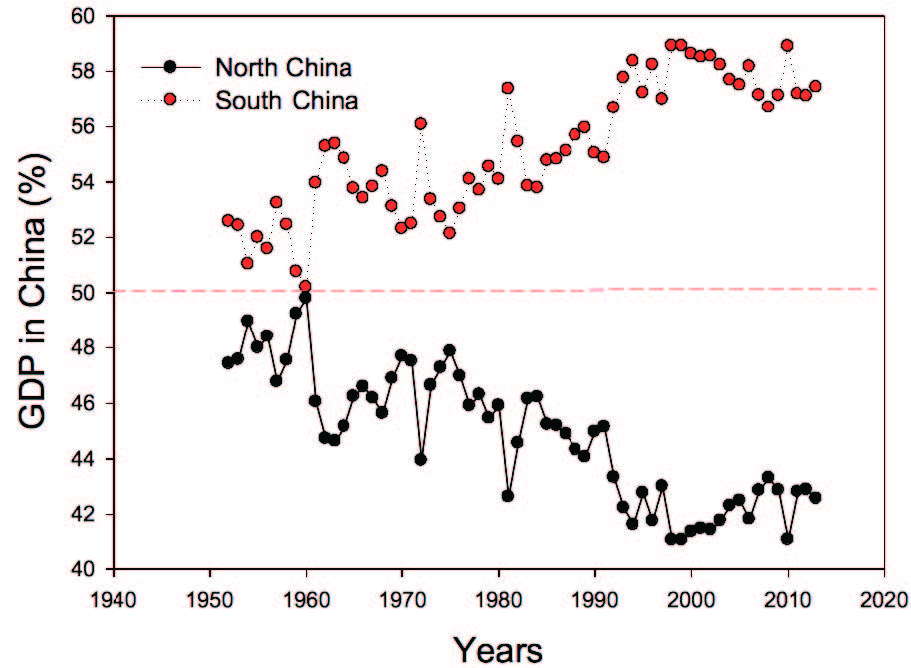
Figure 5. Percentage of Gross Domestic Production (GDP) between North China and South China from 1949 to 2013 (22–28).
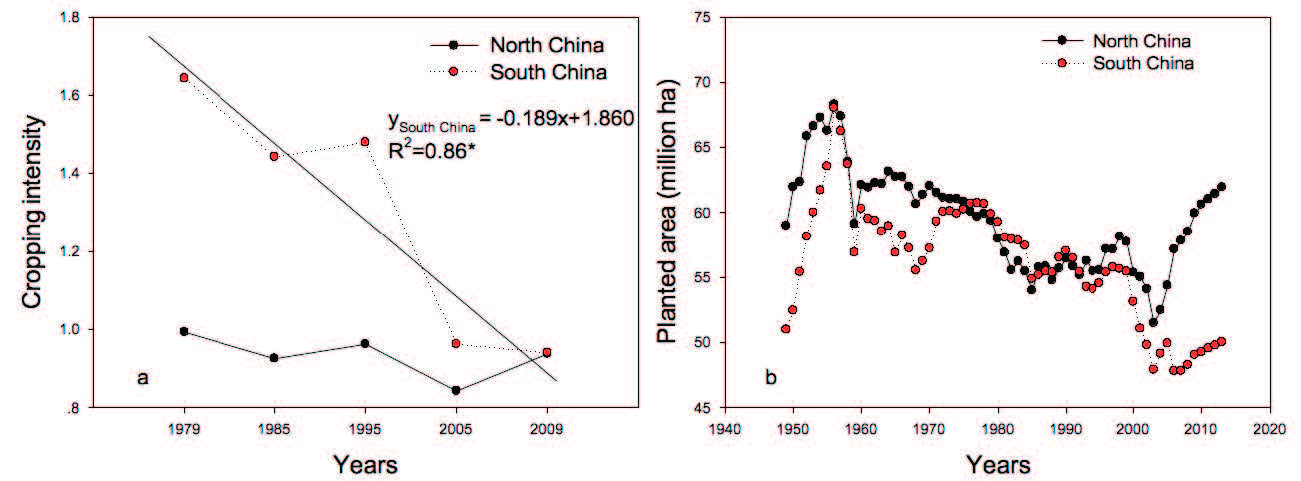
Figure 6. Change in (a) cropping intensity (number of crops harvested per unit area per year) and (b) area planted (planted area) in North China and South China over time (22, 31, 32; Ministry of Agriculture of China website: http://www.moa.gov.cn/).
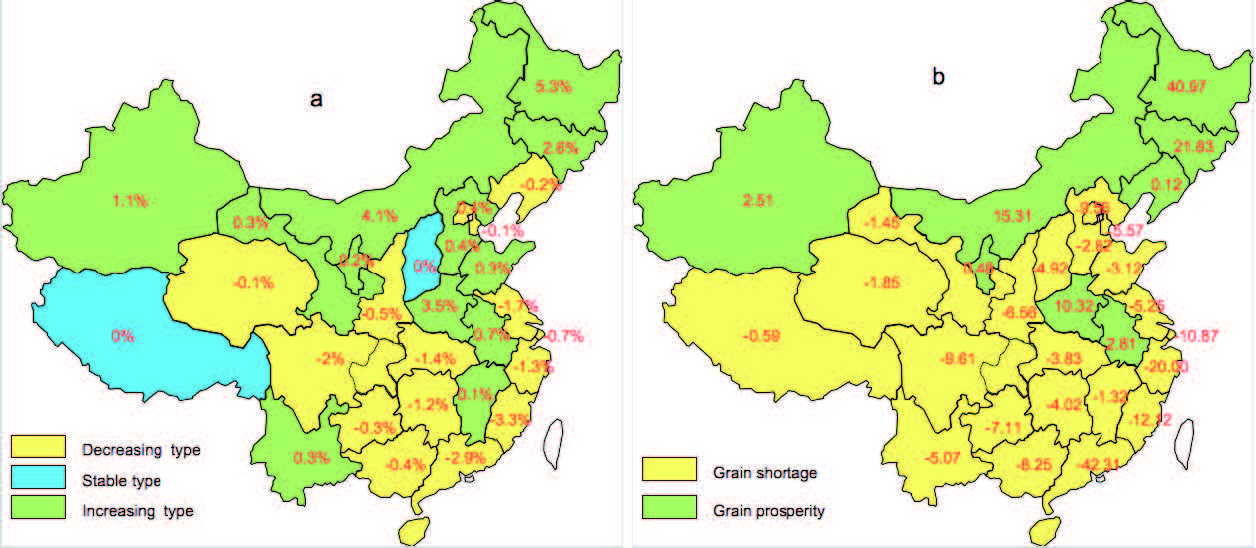
Figure 7. (a) Change in proportional share of grain yield in China from 1978 to 2013 and (b) surplus grain (million tons) in each province, minus sign means grain shortage, Sichuan includes Chongqing, and Guangdong includes Hainan (22, 28).
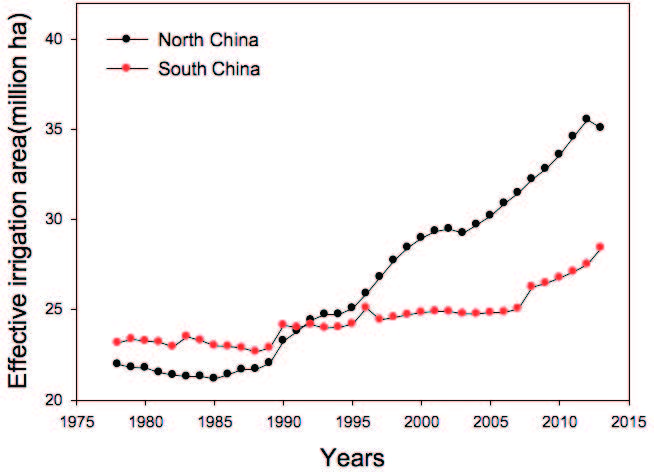
Figure 8. Eff ective irrigation area (land which can be irrigated every year) in North China and South China from 1978 to 2013. Source: Ministry of Agriculture of China website: http://www.moa.gov.cn/.
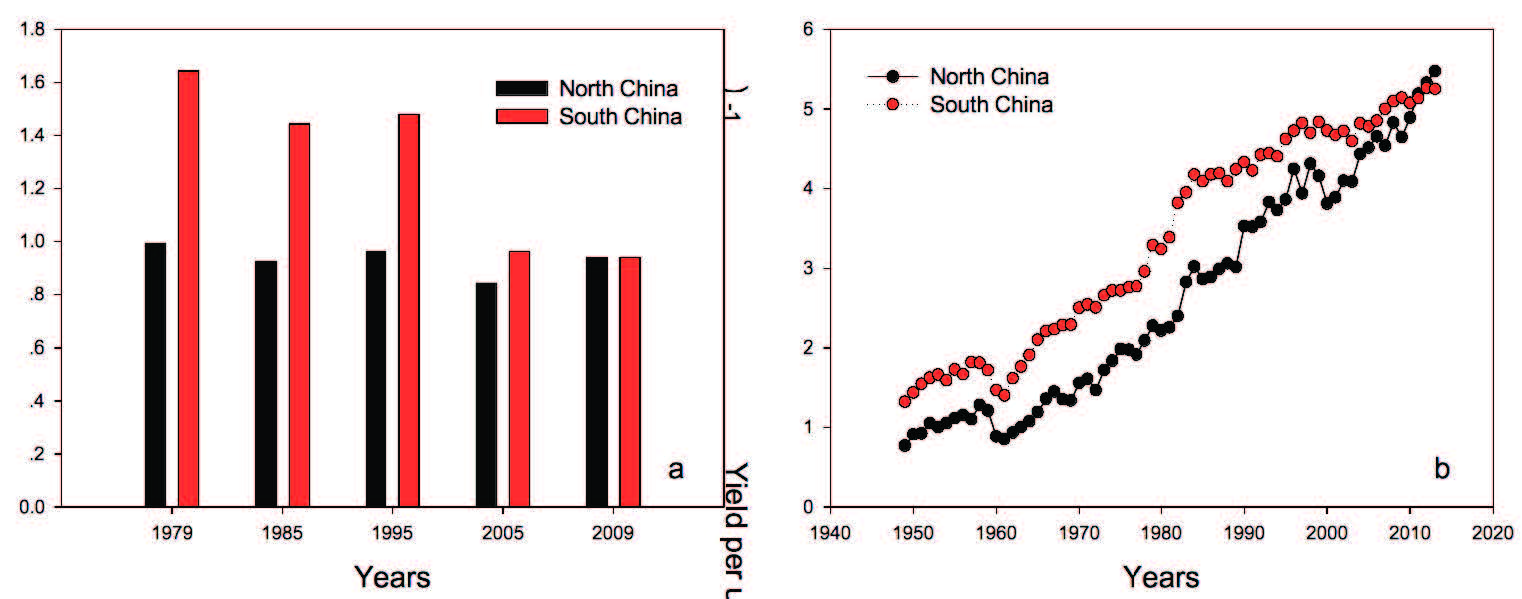
Figure 9. (a) Cultivated area and (b) grain yield per unit area from 1949 to 2013 in North China and South China (22, 31, 32; Ministry of Agriculture of China website: http://www.moa.gov.cn/).
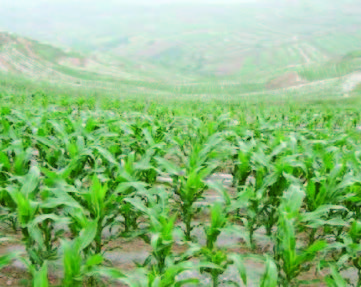
Figure 10. Gansu Province is located in a dry area of Western China. Plastic-fi lm mulch technologies have successfully improved local food production and water use effi ciency. It is estimated that 100 Mha in the province will be under plastic-fi lm mulch in 2016 (44).