
World Food Production – will it be adequate in 2050?
Summary
A system was devised to help understand some of the problems likely to be encountered in feeding the world in 2050.
The system assumed that by 2050 the world population would be approximately 9.4 billion, as predicted by FAO, that all women on average had two offspring and that life expectancy at birth would be constant.
A simple set of fifty-four vegetarian diets was formulated to meet the FAO dietary requirements for energy, protein and dietary limiting amino acids, for nine age groups in six ethnically, geographically and culturally different Domains based on the FAO Regions.
Moreover, an attempt was made for each Domain to be self-sufficient in raw materials and that overall agricultural productivity in 2050 would be similar to that in 2011.
The requirement for minor nutrients was ignored in this model. It was found that globally, the energy needs could be met; but there would be a deficiency of all raw materials in the Sub-Saharan Africa Domain.
The Northern Africa, West & Central Asia and India & South Asia Domains would be deficient in one or two raw materials, whereas the other three Domains should be self-sufficient; but making no allowance for waste.
The results showed that globally, the area of agricultural land required to feed the current world population could be reduced by 30% if production was restricted to the constructed diets and that nitrogen fertilizer use could be reduced by 24%.
Globally, an average of 0.8 kWh/capita is used daily in the manufacture of the nitrogen fertilizer deployed on arable crops, ranging from 1.52 in the West to 0.09 in Sub-Saharan Africa (compared with 2.68 kWh/d human adult maintenance requirement).
It was noted that the protein,N:energy ratio and the lysine:protein,N ratio were both more consistent with their equivalent FAO requirement ratios for rice and to a lesser extent for maize than for bread wheat.
Wheat cultivation therefore has the potential to contribute more to greenhouse gas production than these other cereals.
It is hoped to investigate the effects of variations of this model, including the consumption of animal products, in later Issues.
Abbreviations: FAO: United Nations Food and Agriculture Organisation; ME: Metabolisable Energy; GHG: Greenhouse Gases.
Introduction
Today, in the developed, Western World, we take the availability of plentiful food for granted.
We have a sophisticated infrastructure to ensure timely delivery from the producer to the market. People have become divorced from the sources of production and all associated problems, so much so that we often have an unrealistic view of a lost golden age when we perceive our food was not only better, but was produced in a sustainable manner.
That has never been the case. Man has been degrading the natural environment since farming began, so much so, that in parts of the world it is impossible to determine which environments are man-made and which are natural.
Historically, unpredictable events, such as for example, the plague in mid C14th Europe coincided with a sequence of wet, cool summers with poor harvests1.
In the 1590s volcanic activity again cooled the climate and led to starvation and the plague and in 1816 there was a “year without summer”, following the eruption of Tambora in 1815.
There are other complex interactions, with planetary orbits and the angle of the axis of earth as described by Milankovich2, 3, which create their own cycles and are involved in weather patterns4.
Irrespective of the causes, the earth’s climate does appear to be in a state of flux, with some suggestions that these changes are causing significant disruption to the Northern Hemisphere Jet Stream, which is involved in changes to weather patterns5.
There is a general belief that we need to make society and industry more sustainable.
The definition provided by the Brundtland Committee of the United Nations in 19876 is now commonly accepted – “development that meets the needs of the present without compromising the ability of future generations to meet their own needs.” This paper is prepared within that context, to try and understand the total nutritional carrying capacity of the earth in terms of the human population it can support.
The Royal Society7 identified a need for ‘sustainable intensification’ in its 2009 review of global agriculture and used the word sustainable within the context of increasing output per unit area.
The report recognized the need that as climate varies and populations increase there is a need to produce more food from a reducing land area, without further environmental degradation.
At the outset, it is important to identify that there is probably enough food to give the current world population a basic level of nutrition8.
FAO9 estimates that total production is ca 5500 kcal per person/d (23 MJ/d; 6.39 kWh/d), more than double the daily requirement for a person of average weight. Losses owing to weeds, pests, diseases and post harvest losses, such as those sustained during transport and storage are ca 30%.
The problem is how to meet the nutritional needs of an ever increasing population and the inexorable rise in energy needs of society, meeting which is technically feasible10, but seems to be politically beyond our capabilities at present.
The difficulties with food, apart from production, are associated with distribution, diet, society governance and the fact that large numbers of people live in parts of the world where they are unable to grow their own food, such as deserts, cities and ice fields.
This article looks at global food production from the perspective of the primary crops upon to assess whether Malthus11 might yet be proved right.
The purpose of the analysis described in this paper has been to estimate the capability of current and future food production to meet basic nutritional requirements of the present and predicted populations.
It is an attempt to identify the potential carrying capacity of the earth in terms of the maximum population it can sustain and provide basic nutritional needs. We make no allowance to dietary choice.
We have chosen vegetarian regimes plus milk (Bos taurus (cattle), or Capra hircus (goat)) for three reasons:
* Inaccuracies inherent for both the reliable estimates of Metabolisable Energy (ME) intake globally of animal products and of the large variety of their sources on a global scale;
* The relative inefficiencies of convert- ing solar energy indirectly into animal products, c.f. vegetarian products for direct human consumption and there- fore the land surface used per MJ, ME produced; and
* The adverse effects, especially of ruminants on Greenhouse Gas Production (GHG) production.
Milk has been included because it has a relatively consistent composition, and has valuable nutritional qualities, especially for the young.
Method
Diets
Sources of energy and protein are the major dietary costs and generally the limiting factors to health.
The human daily requirements for Metabolisable Energy (ME), protein and the likely limiting dietary amino acids: lysine, methionine, threonine and leucine were derived from FAO reports12, 13 for each of nine age and reproductive Cohorts (Table 1).
In order to meet these needs a set of constructed diets was derived for each Cohort.
The composition of foods available was based on data from the update of the McCance and Widdowson Tables by Paul and Southgate5, with additional amino acid information from the National Research Council reports14.
These sources allowed us to estimate satisfactory diets for each population. The tabulated nutrient contents of all foods were based on a moisture content of 12% for cereals and pulses, whereas for “root” crops the values varied, but they had been measured in the fresh state.
Overall energy requirements for each age range, as derived from these FAO nutritional requirements are shown in Table 2, where we have used two dietary groups based on the West plus South and Central America and the remainder of the world, as examples.
The requirements for essential fatty acids, minerals, trace elements, vitamins and other necessary substances for maximum health were not estimated.
The formulated dietary mixtures assume current crop cultivars meet the needs to maintain health, and that the needs for these other nutrients could be met without materially affecting production of the major crops. The diets selected were based upon field crops plus milk to estimate the potential of a vegetarian diet and to reduce the risk of miscalculation of diets con- taining animal products.
Dietary Domains
FAO regions were grouped into six Domains on the basis of population, ethnic group, primary diets and the crops produced (Table 3).
In each of the 54 diet groups (nine Dietary Cohorts in each of six Domains) individual daily requirements were converted to annual needs, as weight of raw ingredient needed, to provide the annual energy and protein requirements (Table 4).
The nine diets were constructed to reflect daily nutritional needs for men and women.
The maintenance requirement of energy and amino acids for females is less than that of males (except for females of age 11-12 years and specific diets were created for females during gestation and lactation).
Nevertheless, the assumption was made that in each Domain the sexes were equally distributed, so the mean of males and females is used, allowing for two reproductive cycles per female.
The amount of food was calculated for each of the Dietary Cohorts using the proportion of the population in each Cohort, based on their life expectancy at birth16, and the population size in each Domain.
Populations
Assumptions were made about the body weight of individuals in each population from evidence in FAO reports14,15.
Lifeexpectancyatbirth was assumed to be 78 years for Western and South American populations (W) and 75 years for Eastern and Sub-Saharan African (E) populations16, defined as the two World Areas.
The W population is assumed to have a slightly greater mean body weight at maturity. It is appreciated that this difference may diminish over the next 40 years and that the life expectancy and mature body weight of all populations are likely to rise.
At this future date it is also assumed that each female would produce on average two live births, so the world population would be stable, assuming life expectancy was also constant.
Crop Production
World crop production, using FAO regional data17 for area and yield for each dietary ingredient, grouped into the selected Dietary Domains is given in Table 5. These data were used to develop the quantities of ingredients required for the constructed diets.
Definitions
Metabolisable Energy (ME): Energy for the metabolic and physiological functions is derived from the chemical energy in food and its macronutrient constituents, i.e. carbohydrates, fats, proteins and ethanol.
ME is defined as the Gross Energy (GE) of food, determined calorimetrically, less the energy contents of waste products (faeces, urine & gases).
ME is expressed in joules, J (J = kg m2 s-2), in accordance with the International System of units, where one watt, W = J s-1 andkJ=J.103 &MJ=J.106.We express the daily requirements for energy as MJ/d. (1 MJ is equal to 0.2778 kWh).
Average value of ME provided by a mixed daily diet is 16.74 kJ (4.00 kcal) per g and the value of each foodstuff in each diet is estimated from appropriate food composition tables5,12, 13, 14.
Recommended level of dietary energy intake: This is the mean energy requirement of healthy, well-nourished individuals and is the amount of energy that should be ingested as a daily average over a period of time.
It is assumed that individual requirements are randomly distributed about the mean for each of the population Cohorts, as a Gaussian (normal) distribution.
A normal distribution is symmetric about its mean, i.e. it is not skewed and therefore the mean should provide adequate requirements for the entire population.
The protein and amino acid requirements are assumed to be the mean value plus two Standard Deviations to accommodate 95% of the population.
This is deemed to be a safe level of intake for proteins. Excess protein is generally harmless for individuals with a normal functioning renal system.
This approach cannot be applied to dietary energy recommendations, because intakes that exceed requirements will produce a positive balance, which may lead to obesity in the long term. Moreover, a slightly raised protein intake has been demonstrated to reduce the risk of Type 2 Diabetes and cardio-vascular disease (authors’ evidence).
Results
The data given in table 5 indicate:
1) Yields of all crops (t/ha) are as good or greater in the Western Domain than they are in other Domains, with the exception of pulses, bananas and wheat in South America;
2) Yields are generally poor in Sub- Saharan Africa;
3) Yields are particularly poor for potatoes in China and for soya in Sub- Saharan Africa.
In order to simplify the presentation of this information we have shown the mean values for Dietary Cohorts 1, 2 & 3; 4 & 5; 7, 8 & 9, the total critical components of which are shown in Table 6.
When these values are compared with the daily requirements in Table 1, they demonstrate that we have been able to meet the dietary needs of the Cohorts with the constructed diets.
Tables 7 and 8 indicate that in 2050, Sub-Saharan Africa is predicted to be deficient in all crops with its expected population growth and poor yields (Table 5).
India and to a lesser extent North Africa, West-& Central Asia will be particularly short of rice, whereas China & SE Asia should have a large surplus of rice.
The areas of the world where population growth is greatest will have the greatest deficiencies.
Moreover, whilst India, Africa and Central Asia are predicted to be deficient in potatoes by 2050, the remaining domains are predicted to be able to produce a surplus.
These deficits are reflected in the positive global energy balances given in Table 9, where for the sake brevity we have amalgamated results for groups of crops.
Figure 1 shows that the proportion of the agricultural land area required to produce the constructed vegetarian diets for the world population in 2011 is adequate.
This demonstrates that our constructed diets would save 29% of the global area currently used in production in these crops.
Thus, with an increase in the world population of a quarter by 2050 it should be possible to provide enough food, with these diets.
However, undoubtedly a proportion of the agricultural area will be lost to urban sprawl.
If animal products are required other than milk then the conclusion would be quite different.
Figure 1 also shows that the area required for constructed diets (in red) is no more than half the current areas for the Western and Central and South American Domains, reflecting the large areas devoted to animal products in those areas: whereas for India & South east Asia and Sub-Saharan Africa it is very little different from the present; but for North Africa the Mid-East and Central Asia it is much greater than at present.
This latter observation probably reflects their dependence on imported food stuffs. An assertion which could arise is that there is no need for deforestation of rain forests in Brazil, Africa or in the East Indies to meet the human nutritional needs for these diets.
Figure 2 illustrates current use of nitrogen fertilizers in each Domain, compared with that needed for the constructed diets.
This demonstrates the significant global savings these diets would achieve, which amount to 6 Mt i.e. 24% of global use on arable crops.
The overall fertilizer use (Table 10) shows the variation in nitrogen fertilizer user per capita in each Domain with a global average of 15.18 kg/capita.
The table also estimates energy consumption in fertilizer manufacture which ranges from 0.09 in Sub-Saharan Africa to 1.52 kWh/capita daily in the West Domain.
Figure 3 indicates that over the last 40 years the rate of increase in the yield of cereals has been at an annual rate of 0.0185, i.e. nearly an exponential rate of 2% – that must exceed the current rate of population growth.
The yields of pulses and of “roots” over the last half century have generally been positive but quite irregular per decade, perhaps reflecting their sensitivity to weather conditions.
Wheat
Wheat is the major cereal crop used for bread making, partly because its protein contains relatively large quantities of gluten which promotes the rising of dough.
The gluten is a composite of a gliadin and a glutenin that are poor quality proteins relatively deficient in the dietary limiting amino acid lysine. We found that lysine was the first limiting amino acid in all of our fifty-four different diets.
Bread wheat is a relatively high protein cereal and hence its yield responds well to N fertilizers.
The production of N fertilizer has been an essential element in the increase in world population, i.e. without it world population would have plateaued already.
If world population is to rise to rise to >9 billion, this will only occur with an increase in N fertilizer production (not necessarily in proportion, as many other factors will be critical).
Nevertheless, the Haber Bosch process for the fixation of atmospheric N2 as NH3 currently consumes 7 per cent of all man made energy (mostly electrical) and natural gas (Smil20). Table 11 indicates that the ratio of wheat protein N:wheat energy is 1.84 times the ratio of the FAO requirement for protein:energy, of adult maintenance.
This implies that there will be a considerable amount of waste N lost to the body by renal excretion. This consequence is also indicated by diets based on cereal protein, especially, that of wheat, as the ratio of the wheat lysine:wheat N is only 58% of the FAO requirement for lysine:protein N.
This means that the natural N cycle is accelerated with a likely greater production of atmospheric nitrogen oxides than would be the case if rice, or even maize was the staple crop, as these crops possess ratios of, dietaryN:MJ energy, and lysine:dietary N, closer to the ratios required by the FAO human requirements for maintenance (Table 11).
Discussion
The assumptions made in this model allow for a reliable starting point. Variations on this incorporating, for example, other animal products will be possible in future models.
A similar calculation was conducted for the two world areas, W & E, which adjusted the energy requirement according to the proportion of the population within each age group, including the two reproductive cycles per female.
Details of the factors by which the requirements of each area were adjusted are given in Table 5.
The overall mean daily FAO energy requirements are estimated to be 9.8619 and 9.4584 ME, MJ for the two areas W and E, respectively.
These values are used to estimate crop needs for each of the Dietary Domains for 2011 as well as for the estimated populations in 2030 and 2050 and reflect the proportion of each population present in each age group at any given instance in time.
Although the requirements for protein and amino acids are liberal they are unlikely to impact greatly on the estimated production rates of crops needed to sustain populations in 2050, as we found that it was rare for the diets formulated for the future to have an essential amino acid to be the first limiting nutrient- normally this was energy.
Occasionally lysine was the first limiting nutrient, no other amino acid fulfilled this role. In diets based upon rice, protein was limiting in a number of cases, however it could be questioned whether this is relevant if all the more likely dietary essential amino acids are found to be adequate. This observation is discussed elsewhere in this report.
Table 10 indicates that the global average N fertilizer use is equivalent to 468 kWh/ha. This is a considerable source of greenhouse gas production, discussed elsewhere in this Issue by Professor Wilkinson, who estimates the carbon footprint of animal production.
What is equally striking in the data of Table 10 is the great range in fertilizer use per person and per hectare. In energy terms this ranges from 2.52 kwh/capita/d in the West to 0.09 kWh/capita/d in Sub-Saharan Africa, a 28-fold range, with a global mean of 0.8 kWh/cap/d.
To put this into human terms, Table 11 shows the mean adult maintenance requirement to be 2.834 kWh/capita/d- not too different!
Perhaps more extreme is the range in use of N fertilizer use per ha: 68.9 kg/ha in India down to 1.39 kg/ha in Sub-Saharan Africa, a 50-fold range.
It has been suggested that a greater, but appropriate use, of fertilizers in Africa should reduce the rate of destruction of rain forest in the search for fertile land. Nevertheless, it should be noted that N fertilizers are not always the limiting factor to production as frequently fresh water is and many African soils are deficient in phosphates22.
The nutritional adequacy of current vegetarian mixtures has not been discussed although milk was included in the diets, as this food is likely to be essential, especially for the young as a source of cyanocobalamin and other valuable nutrients.
The introduction of current animal products, especially meats, could profoundly change the balance, quite apart from ruminants, that are a source of potent greenhouse gases, especially that of methane.
Iron deficiency is a major worldwide problem, especially among women, common amongst those on poor vegetarian diets low in protein and iron contents.
Nevertheless, if vegetarian diets become mandatory for the world to avoid starvation it would be very difficult to enforce this regime in democracies. Moreover, current consumption of meats is increasing globally.
Migration is likely to occur at greater rates than at present for the reasons that, (1) areas where productivity is lowest tend to have greater rates of population increase, and (2) these areas are likely to be greatly and adversely influenced to by climate change.
We have assumed that life expectancy will not increase beyond those limits assumed in this study.
But a 5% increase in life expectancy means a 5% increase in population without an increase in birth rate of two per couple.
Moreover we assume that the body mass of the individual does not change, whereas a 5% increase in that mass leads to approximately a 3% increase in maintenance energy needs. It has also been assumed that overall agricultural productivity will not change- that is advances in productivity may be balanced by adverse effects of climate change.
We have the FAO export data for 2011, and although they have not been considered, they have clearly influenced some of our values in both Figures 1 and 2.
increase (based on decadal data) with a predicted population increase in the Sub-Saharan Domain of >1 billion during the next 40 years (with an exponential index of about 1). The data for India and South Asia and for North Africa and West Asia also shows initial increases in rate, but the rate was predicted to decline over the period 2011-2051. China has a policy and the increment declines steadily with a decrease in total population during the period, 2030-2051. The rise detected in the West may have been caused by migration up to 2011.
Thus, overall there is predicted to be a falling rate of population increase up to 2051 in all Domains with the exception of Sub-Saharan Africa, where the population increase between 2030 and 2051 is predicted to be over 582 million with the net global increase of 1,040,972,000 over those final twenty years.
Moreover, our model assumes there is no change in the productivity in any Domain, whereas the productivity of Domains most likely to be adversely affected by climate change are already predicted by the model to be inadequate in 2050. (see Turner, pp. 25-28, this Issue)
The limiting nutrient was assessed in each Domain (a small amount of milk was included in most diets with greater quantities in the diet of the young):
1) It was found that energy was limiting in the Western & South American Domains. Whereas protein tended to be used excessively in order to achieve the minimum lysine requirement. These diets were based on wheat maize & soya. The western diets were supplemented with potatoes, whereas the S. American diets were supplemented with yams, but with one diet supplemented with potato.
2) Protein was limiting in the Chinese and East-Central Asia, but the amino acid balance was satisfactory – as excess protein was unnecessary for the diets to provide the minimum essential amino acids. The diets were based on rice, maize, soya and potato.
3) Indian diets met the requirements for energy, protein and amino acids uniformly- these diets were formed from a mixture of rice, wheat, lentils & soya, and cassava.
4) Sub-Saharan African diets required excess protein in order to achieve the minimum lysine requirement. Lysine and energy were equally limiting.
But a 5% increase in life expectancy means a 5% increase in population without an increase in birth rate of two per couple. Moreover we assume that the body mass of the individual does not change, whereas a 5% increase in that mass leads to approximately a 3% increase in maintenance energy needs. It has also been assumed that overall agricultural productivity will not change- that is advances in productivity may be balanced by adverse effects of climate change.
We have the FAO export data for 2011, and although they have not been considered, they have clearly influenced some of our values in both Figures 1 and 2.
Figure 2. Fertilizer use in 2010 on the selected crops (blue) and that required to meet the needs of the constructed diets (red).
Figure 3. Decadal rate of change in cereal yields, using the mean for each of the cereal crops in the constructed diets in each Domain (FAO data 2011).
increase (based on decadal data) with a predicted population increase in the Sub-Saharan Domain of >1 billion during the next 40 years (with an exponential index of about 1). The data for India and South Asia and for North Africa and West Asia also shows initial increases in rate, but the rate was predicted to decline over the period 2011-2051. China has a policy and the increment declines steadily with a decrease in total population during the period, 2030-2051. The rise detected in the West may have been caused by migration up to 2011.
Thus, overall there is predicted to be a falling rate of population increase up to 2051 in all Domains with the exception of Sub-Saharan Africa, where the population increase between 2030 and 2051 is predicted to be over 582 million with the net global increase of 1,040,972,000 over those final twenty years.
Moreover, our model assumes there is no change in the productivity in any Domain, whereas the productivity of Domains most likely to be adversely affected by climate change are already predicted by the model to be inadequate in 2050. (see Turner, pp. 25-28, this Issue)
The limiting nutrient was assessed in each Domain (a small amount of milk was included in most diets with greater quantities in the diet of the young):
1) It was found that energy was limiting in the Western & South American Domains. Whereas protein tended to be used excessively in order to achieve the minimum lysine requirement. These diets were based on wheat maize & soya. The western diets were supplemented with potatoes, whereas the S. American diets were supplemented with yams, but with one diet supplemented with potato.
2) Protein was limiting in the Chinese and East-Central Asia, but the amino acid balance was satisfactory – as excess protein was unnecessary for the diets to provide the minimum essential amino acids. The diets were based on rice, maize, soya and potato.
3) Indian diets met the requirements for energy, protein and amino acids uniformly- these diets were formed from a mixture of rice, wheat, lentils & soya, and cassava.
4) Sub-Saharan African diets required excess protein in order to achieve the minimum lysine requirement. Lysine and energy were equally limiting.
Conclusions
Making no allowance for food waste, it can be concluded from the model employed that the world could be fed in 2050 to meet the FAO nutrient requirements for Metabolizable Energy, protein and the limiting dietary amino acid lysine, by universally adopting a vegetarian diet plus milk. Whether such a regime could be imposed is another matter.
There was however wide variations amongst the six Domains with Sub-Saharan Africa becoming deficient in all raw materials.
This is in part a consequence of a high birth rate and an inadequate adoption of biotechnological advances.
Figure 4 shows the twenty year rate of increase (based on decadal data) with a predicted population increase in the Sub-Saharan Domain of >1 billion during the next 40 years (with an exponential index of about 1).
The data for India and South Asia and for North Africa and West Asia also shows initial increases in rate, but the rate was predicted to decline over the period 2011-2051.
China has a policy and the increment declines steadily with a decrease in total population during the period, 2030-2051. The rise detected in the West may have been caused by migration up to 2011.
Thus, overall there is predicted to be a falling rate of population increase up to 2051 in all Domains with the exception of Sub-Saharan Africa, where the population increase between 2030 and 2051 is predicted to be over 582 million with the net global increase of 1,040,972,000 over those final twenty years.
Moreover, our model assumes there is no change in the productivity in any Domain, whereas the productivity of Domains most likely to be adversely affected by climate change are already predicted by the model to be inadequate in 2050. (see Turner, pp. 25-28, this Issue)
The limiting nutrient was assessed in each Domain (a small amount of milk was included in most diets with greater quantities in the diet of the young):
1) It was found that energy was limiting in the Western & South American Domains. Whereas protein tended to be used excessively in order to achieve the minimum lysine requirement. These diets were based on wheat maize & soya. The western diets were supplemented with potatoes, whereas the S. American diets were supplemented with yams, but with one diet supplemented with potato.
2) Protein was limiting in the Chinese and East-Central Asia, but the amino acid balance was satisfactory – as excess protein was unnecessary for the diets to provide the minimum essential amino acids. The diets were based on rice, maize, soya and potato.
3) Indian diets met the requirements for energy, protein and amino acids uniformly- these diets were formed from a mixture of rice, wheat, lentils & soya, and cassava.
4) Sub-Saharan African diets required excess protein in order to achieve the minimum lysine requirement. Lysine and energy were equally limiting.
These diets were based on grain sorghum, pulses, tropical beans and cassava.
5) The high energy costs of N fertilizer synthesis (7% of total man- made energy production used in the Haber-Bosch synthesis) and increased volatilization of N oxides, indicate a need for an increase in precision for its application in relation to soil conditions and weather.
There is a need for solar energy to be used more directly in the fixation of atmospheric N2. In 2011, 45% of the world population depended on N fertilizers for their existence (Smil20).
References
1.Kington, J (2010) Climate and Weather. HarperCollins, London W6 8JB. ISBN 978-0- 00-718501-6
2.Imbrie, J; Boyle, E A; Clemens, S C; Duffy, A; Howard, W R; Kukla, S; Kutzbach, J; Martinson, D G; Mcintyre, A; Mix, A C; Molfino, B; Morley, J J; Peterson, L C; Pisias, N G; Prell, W L; Raytoo, M E ; Shackletons, N J; Toggweiler, J R (1992), On the structure and origin of major glaciation cycles. 1. linear responses to Milankovitch forcing. Paleoceanography, 7, no. 6, pages 701-738,
3.Anon (2013) Milankovitch cycles. Wikipedia. http://en.wikipedia.org/wiki/Milankovitch_cycl es accessed April 2013
4.Scaffeta, N (2013) Astronomical/Solar/Climate model. http://www.people.duke.edu/-ns 2002/Nicola.Scaffetta accessed April 2013
5.Francis, J A; Vavrus, S J (2012) Evidence linking Arctic amplification to extreme weather in mid-latitudes. Nature Geophysical Research Letters 39 L06801
6.Anon (1987) Report of the World Commission on Environment and Development: Our Common Future United Nations < http://www.un- documents.net/wced-ocf.htm > accessed 2012
7.Anon (2009) Reaping the Benefits: Science and sustainable intensification of global agriculture. The Royal Society, London SW1Y 5AG. ISBN 978-0-86403-784-1
8.Anon (2008) World Development Report. World Bank, Washington
9.Anon (2012) World Statistical Yearbook, 2012; World Food and Agriculture. FAO, Rome. ISBN 978-92-5-107084-0. http://www.fao.org/docrep/015/i2490e/i2490 e00.htm > accessed May 2012.
10.Mackay, D (2008) Sustainable Energy without the Hot Air. UIT Cambridge Ltd, ISBN 978-1-906860-01-1
11.Malthus, T R (1798) Essay on the Principle of Population. J Johnson, London
12.Anon (2001) FAO Food And Nutrition Technical Report Series 1. Human energy requirements, i-ix, pp. 1-96. Report of a Joint FAO/WHO/UNU Expert Consultation, Rome, 17-24 October 2001. UNITED NATIONS UNIVERSITY WORLD HEALTH ORGANIZATION, FOOD AND AGRICULTURE ORGANIZATION OF THE UNITED NATIONS, Rome, 2004 ISBN 92- 5-105212-3, ISSN 1813-3932.
13.Anon (2002) Protein and Amino Acid Requirements In Human Nutrition, i-xi, p. 1- 270. Report of a Joint WHO/FAO/UNU Expert Consultation, United Nations University, Joint WHO/FAO/UNU Expert Consultation on Protein and Amino Acid Requirements in Human Nutrition, Geneva, 9–16 April 2002 ISBN 978 92 4 120935 9.
14.Anon (1986) Nutrient Requirements of Cats, i-ix, pp. 1-79. Revised Edition 1986. Subcommittee on Cat Nutrition, Committee on Animal Nutrition, Board of Agriculture, National Research Council National Academy press, Washington, DC 1986. ISBN 0-309- 03682-8.
15.Paul, A.A. & Southgate, D.A.T (1988) McCance and Widdowson’s The Composition of Foods, 4th Revised and Extended edition of MRC Special Report No. 297, MAF & F, MRC,i- xii, pp.1-418. HM Stationery Office , Oxford, Amsterdam, New York Elsevier, North-Holland Biomedical Press, ISBN HMSO 0 11 450036 3 ISBN Elsevier/North-Holland 0 444 80027 1
16.Anon (2013) List of countries by life expectancy. http://en.wikipedia.org/wiki/List_of_countries_ by_life_expectancy accessed March 2013
17.Anon (2013) FAOSTAT, Food and Agriculture Organisation of the United Nations, Rome. http://faostat3.fao.org/home/index.html#DOW NLOAD Accessed February 2013.
18.Wilkinson, M. (2013)
19.Marsh, Sir John (2013)
20.Smil, V. (2011) Nitrogen cycle and world food production. World Agriculture, 2, (1), 9- 13.
21.Alderman, G. & Cottrill, B.R. (1993) Energy and protein requirements of ruminants. An Advisory manual prepared by the AFRC Technical Committee on Responses to Nutrients.pp.1-159. CAB INTERNATIONAL,Wallingford, Oxon, OX10 8DE, UK., ISBN 0 85198 851 2.
22.Brookes, P.; Lin, Q.; Ayaga, & Wu, J.(1010). Soil phosphorus- from Feast to Famine. World Agriculture, 1, (1), 29-36.
Download pdfFigures
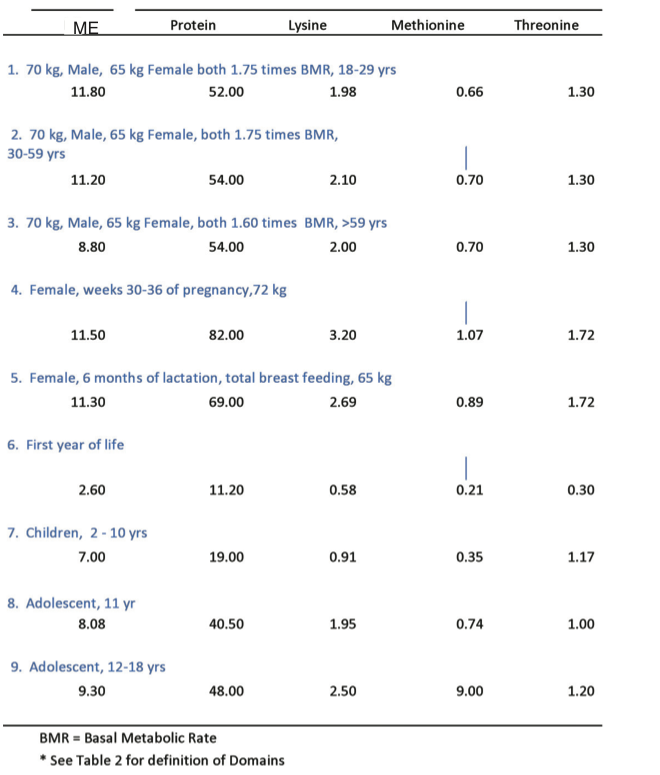
Table 1. Human daily requirements of Metabolisable Energy (ME, MJ), protein (g) and of dietary limiting amino acids (g) for maintenance, growth and for pregnancy and lactation. Estimates assume a body mass (kg) equivalent to the Western Domain* (Values based on FAO sources).
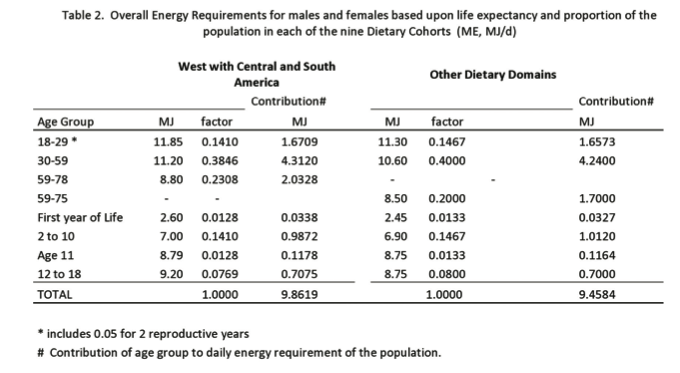
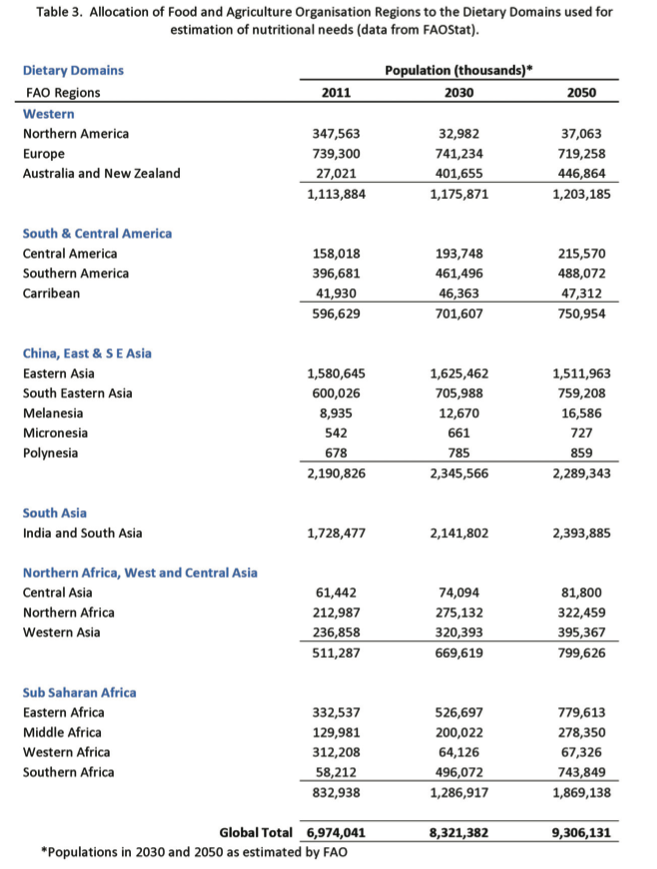
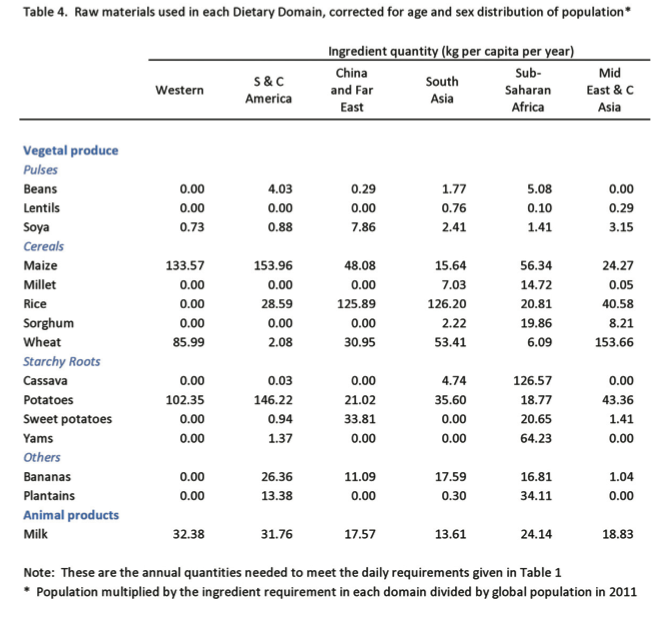
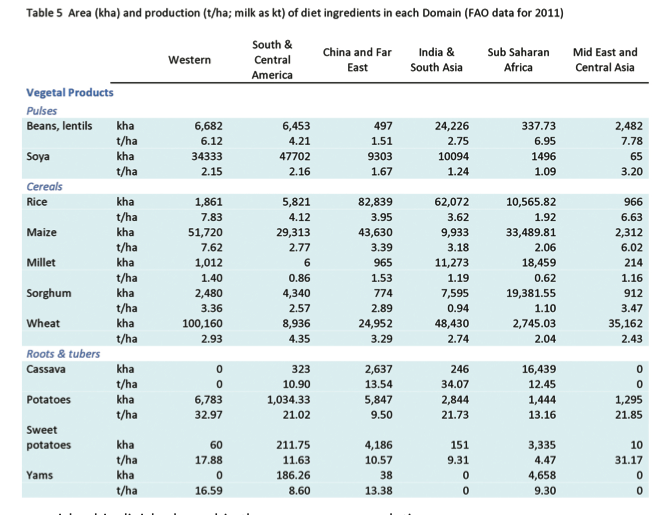
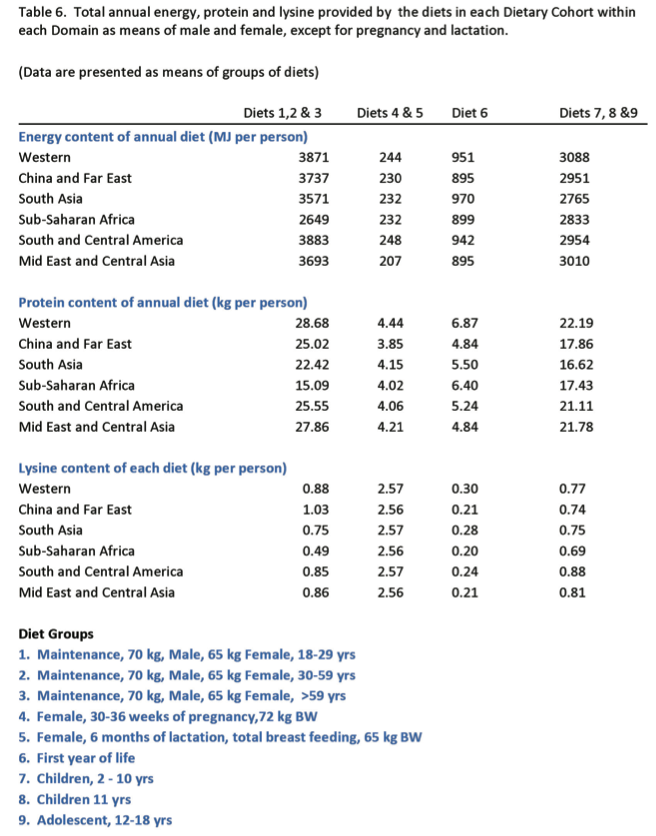
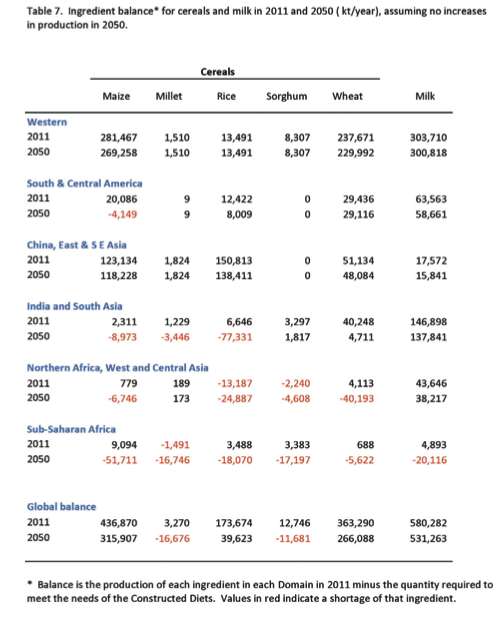
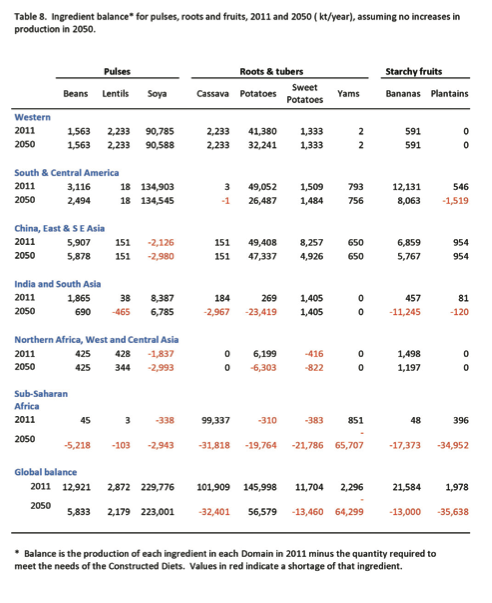
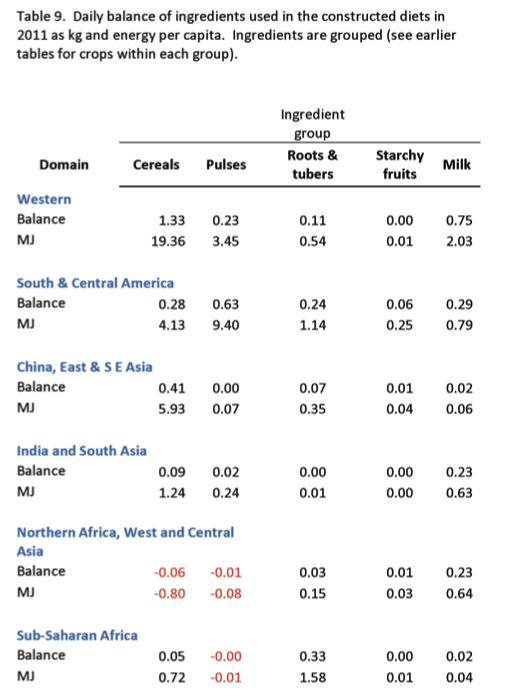
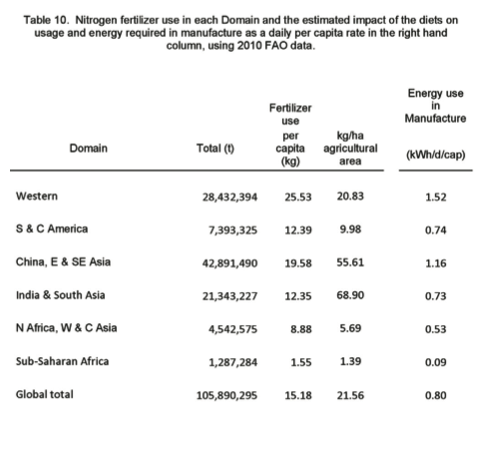
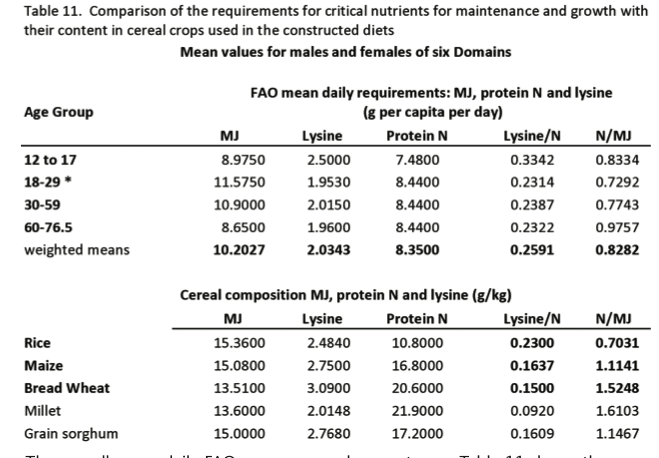
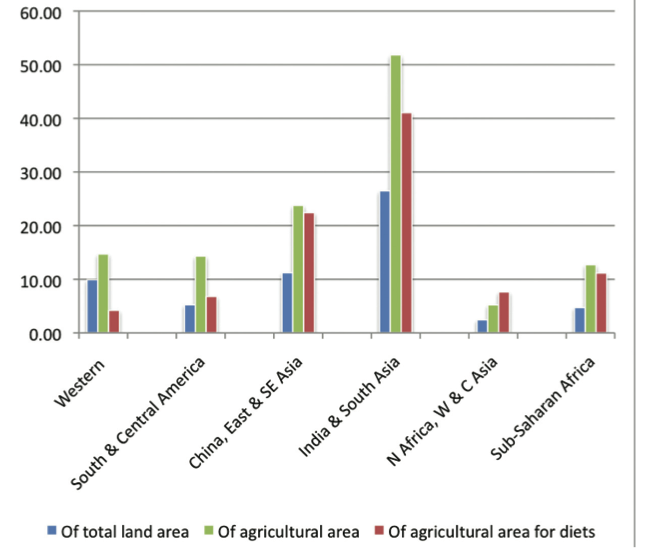
Figure 1. Percentage of total land (blue) and of the agricultural area (dark green) in each Domain used for production of selected crops compared with the area of those crops required for the constructed diets (red), using 2011 data from FAO.
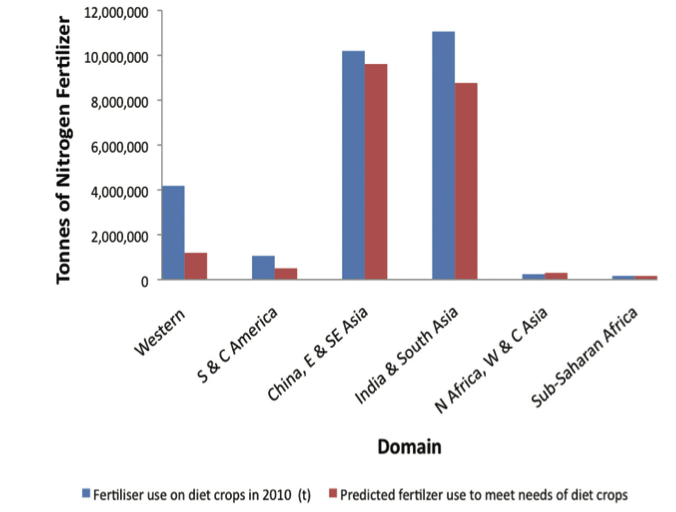
Figure 2. Fertilizer use in 2010 on the selected crops (blue) and that required to meet the needs of the constructed diets (red).
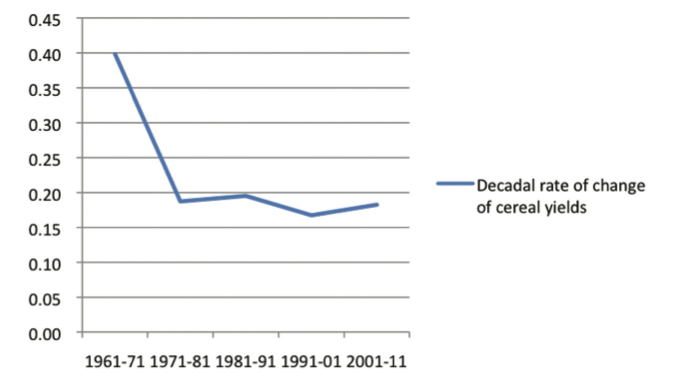
Figure 3. Decadal rate of change in cereal yields, using the mean for each of the cereal crops in the constructed diets in each Domain (FAO data 2011).
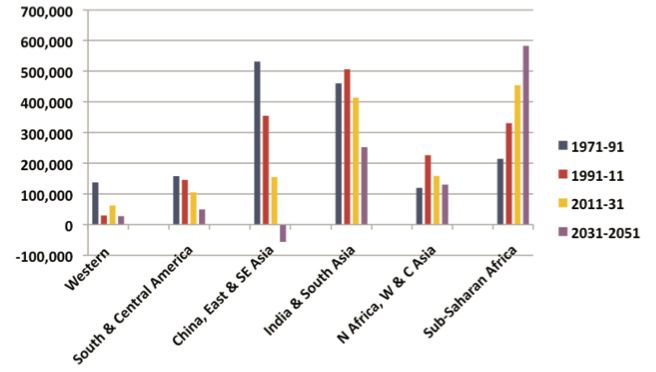
Figure 4. Population change in each Domain as numbers per twenty years (1,000s)from 1971 to 2011, with FAO estimated changes up to 2050 (Data from FAOStat).