
Using climate information to support crop breeding decisions and adaptation in agriculture

Summary
Population growth in the next few decades will increase the need for food production, while the yields of major food crops could be impacted by the changing climate and changing threats from pests and pathogens.
Crop breeding, both through conventional techniques, and GM assisted breeding could help meet these challenges, if adequately supported by appropriate information on the future climate.
We highlight some of the major challenges for crop breeders and growers in the coming decades, and describe the main characteristics of crop breeding techniques and other adaptation options for agriculture.
We review recent uses of climate information to support crop breeding decisions and make recommendations for how this might be improved.
We conclude that there is significant potential for breeders to work more closely with climate scientists and crop modellers in order to address the challenges of climate change.
It is not yet clear how climate information can best be used. Fruitful areas of investigation include: provision of climate information to identify key target breeding traits and develop improved success criteria (e.g. for heat/drought stress); identification of those conditions under which multiple stress factors (for example, heat stress, mid-season drought stress, flowering drought stress, terminal drought stress) are important in breeding programmes; use of climate information to inform selection of trial sites; identification of the range of environments and locations under which crop trials should be performed (likely to be a wider range of environments than done at present); identification of appropriate duration of trials (likely to be longer than current trials, due to the importance of capturing extreme events); and definition of appropriate methods for incorporating climate information into crop breeding programmes, depending on the specific needs of the breeding programme and the strengths and weaknesses of available approaches.
Better knowledge is needed on climate-related thresholds important to crop breeders, for example on the frequency and severity of extreme climate events relevant to the product profile, or to help provide tailored climate analyses (particularly for extreme events).
The uncertainties inherent in climate and impact projections provide a particular challenge for translating climate science into actionable outcomes for agriculture.
Further work is needed to explore relevant social and economic assumptions such as the level and distribution of real incomes, changing consumption patterns, health impacts, impacts on markets and trade, and the impact of legislation relating to conservation, the environment and climate change.
Key words
Climate change, decision-making, pathogens, pests, diseases, adaptation
Future challenges for crop breeding
The grand challenges that we face as humans – a growing population to feed, land degradation, food price spikes, fluctuating energy costs, extreme weather and emerging pests and pathogens – are all pertinent to threats to agriculture in the 21st century.
Here, we consider how best to exploit climate information to protect our crops against change, with particular focus on informing plant breeding techniques for a changing climate.
What might the changing climate and growing world population mean for crop production?
The world’s population is projected to increase from 7.2 billion to 8.4 billion by 2030, with 85% of the future population living in the developing world (1).
The growing population, and changing demographic trends (e.g. lifestyles, wealth, diets) will increase the demand for natural resources.
Over the same time period, the demand for water and energy could increase by 40 and 50% respectively and for food by 35% (2).
These pressures could be further exacerbated by the changing climate, particularly in the longer-term.
The global mean surface temperature change for the near-term (2016–2035), relative to 1986–2005 will likely be in the range of 0.3°C to 0.7°C (3). As well as these average changes, more frequent hot and fewer cold temperature extremes are projected over most land areas on daily and seasonal timescales.
As a result, more frequent and longer heat-waves are projected although there will continue to be occasional cold extremes (3).
It is not only the absolute change in temperature which is important for agriculture, but how temperatures change relative to present-day experience of background variability in climate.
For example, due to the relatively small inter-annual temperature variability in the tropics (4), low latitude countries are projected to experience measureable change in climate earlier than temperate regions (Fig. 1).
Furthermore, for many tropical countries, local warming outside past variability is either emerging at present, or could emerge in the next few decades.
Annual average precipitation is likely to increase over high latitudes and many mid-latitude wet regions of the world, but decrease over many mid-latitude and subtropical dry regions.
Over most of mid-latitude and wet tropical regions, extreme precipitation events are likely to become more intense and more frequent by the end of this century.
The area encompassed by monsoon systems is likely to increase, but with weaker monsoon winds, more intense precipitation, earlier (or unchanged) onset dates and later retreat dates, resulting in longer monsoon seasons over many regions (3).
How will this affect the major energy food crops of the world? The overall effect will depend strongly on the nature of local climate change, the crop, region, and management factors, and whether climate adaptation measures are used.
Here, we consider the crops which currently cover over around 40% of global agricultural land (rice, wheat and maize) and are mindful of the two crops growing in global importance as food and animal feed (soya beans and potatoes).
Global wheat harvests, for example – reached 713 million metric tonnes (Mmt) in 2013 (5), with 20% of this being produced within the EU.
Yields of the major crops have increased steadily across Europe over the past 40 years (6), largely due to technological developments, although yields have stagnated recently (7,8)
The greater rise in historic yields in Northern Europe, compared to Southern Europe (9) is particularly interesting, as it indicates that temperature and rainfall may have more strongly influenced yields in Northern Europe, and warming may already be affecting European yields (Fig. 2).
More broadly, the IPCC Fifth Assessment Report (10) indicates that recent climate trends (particularly warming (11)) have negatively impacted wheat and maize production in many regions, with corresponding reductions in global aggregate production of these crops.
Recent trends in climate appear to have had smaller impacts on rice and soya bean yields both in major growing regions and globally.
However, crop yields appear to have benefitted from warming in some cooler high latitude regions such as the UK and northeast China (10).
Analysis of national yield statistics for rice, wheat and maize over the last 50 years also tends to indicate increasing year-to-year variability for many crop-country combinations (12).
The effects vary considerably across countries, and crops – for wheat, significant declines in yield variability were found for China, India, France and the UK (12).
In some cases, changing yield variability was linked to changing climate variability: wheat in India, maize in Argentina and France, and rice in Vietnam, Thailand, Myanmar and Japan (12).
Projecting forwards, global wheat harvests will likely decline by 6% for each degree C rise in temperature (11), with yields becoming more variable both with time and location, although these results do not include the effect of changing rainfall patterns, or elevated carbon dioxide (CO2) concentrations.
For the end of the century (Fig. 3), using Global Gridded Crop Models (GGCMs) driven by data from General Circulation Models (GCMs), Rozensweig et al.(13) (who do consider rainfall and CO2 changes) project increased wheat yields in cooler, northern regions such as Northern Europe, Northern Asia, Northern USA, Canada and Southern South America; and declines in wheat yields for warmer zones (Brazil, Africa, India, Indonesia, Australia) as well as the Eastern USA.
Maize yields are projected to decline in most regions, except for Northern Europe and Northern Asia, the most northerly parts of the USA, Canada and Southern South America and Southern Australia, largely consistent with findings based on field trials (14).
Rice and soya bean yields could decline in many growing regions, Central Asia and parts of East Asia, Northern USA, and Southern South America (13), although increases are indicated for Southern Australia.
These changes are from crop models which include the impact of nitrogen stress, and provide much more pessimistic outlooks for the yields of most crops than models without nitrogen stress, highlighting the importance of nitrogen supply.
However, there are considerable uncertainties in these results, related to the effects of higher CO2 concentrations, water availabilities and the role of irrigation, and across the different crop models, climate models and future scenarios.
Greater yield losses are generally projected for the second half of the century than for the first, and there is greater agreement for end-of-century declines in tropical yield declines than in temperate regions.
Less is known about future changes in year-to-year variation in yields, but increasing variability is considered likely (15). The studies discussed here do not generally include adaptation measures to deal with the changing climate – these are discussed later in the paper.
Changes to the water cycle could also have significant impacts on agricultural production. The global demand for irrigation water for crops is projected to increase in crop models which include the effect of elevated CO2, but change little or decrease in crop models that do not include this effect (16).
By contrast, hydrological models suggest strong increases in irrigation demand (16). Globally, the area under drought is generally projected to increase, but some regional decreases in the time spent in drought could occur, depending on the drought metric used (17,18).
While increases in the occurrence and severity of river flooding are projected for approximately half of the global land area, decreases are indicated for about a third of the land surface (19), particularly in regions where snowmelt dominates spring river flow peaks.
A range of other climate-related factors could also impact future crop production, including changes in storm patterns, sea level rise (due to thermal expansion, melting of glaciers, ice caps and ice sheets), and increased atmospheric ozone concentrations which can negatively affect crop yields (20).
While such changes in climate, crop yields, and the water cycle are important locally and nationally, they could also have impacts in other regions of the world through their effects on trade and markets.
By the 2050s, UK winter wheat yields are generally projected to increase in the absence of heat and drought stress (21), although yield losses are projected for the South, and gains for the North (22); these results are highly sensitive to assumptions regarding management and other factors (e.g. fertilization, sowing dates, CO2 fertilization, etc).
On the other hand, 40% of food in the UK is currently imported, and this proportion is rising (23), highlighting the UK’s dependency on food production in other regions.
Fluctuations in the world’s crop trading prices also provide a useful marker of the state of agriculture, and respond the needs of a rising population, changes in supply/demand, and to changes in weather and climate.
Relative to a scenario with perfect climate change mitigation (avoidance), 2050s rice prices could increase by between 18-20%, maize prices by 32-34% and those for wheat by 23-24% (24).
Similarly, a more recent study indicates that by 2050 average producer prices for coarse grains, oil seeds, wheat, and rice could increase by around 20% (25).
At national to local scales, differing impacts on seasonal climate, variability and extremes are projected. For example, the UK 2009 Climate Projections report (UKCP09; 26) indicated hotter drier summers, and warmer wetter winters in the long term, averaged over a 30-year period.
However, the underlying natural variability of weather and climate has resulted in recent individual seasons that do not follow these trends, such as the very cold winter of 2010, the wet summer of 2011 and the cold spring of 2013.
The risk of experiencing extreme seasonal weather conditions could change. By the end of the century, the risk of experiencing very hot summers could increase by up to 20-fold, that of very wet winters could increase by up to 6-fold, and that of very dry summers by up to 8-fold.
But in the nearer term, projections suggest a 35% chance of experiencing wet summers (until the 2040s) and a 20-30% chance of cold winters (until the 2020s) (27); these probabilities decline later in the century.
As a consequence, the UK is projected to experience a doubling in both area of high-quality horticultural/arable land flooded every 3 years, and changes in irrigation demands of -10 to +80% by the 2050s (21).
While UKCP09 suggests increases in heavy rainfall events during the winter, very recent studies using high resolution climate models suggest increases in the intensity of very heavy rainfall events in both summer and winter (28).
Changes to the climate variability and the nature of extreme seasons and variability are particularly important for agriculture.
Extreme weather events can have a range of impacts on agriculture (29,30) such as high temperature impacts on crop stress (particularly around flowering), direct heavy rainfall impacts on crops (lodging, water-logging), inundation of agricultural land, access to land for agricultural operations, soil, nutrient and contaminant loss, and the impacts of drought on water availability.
For example, while summer 2012 was a remarkably wet year from the climatological perspective, it also reduced wheat yields in the UK by 14% (31).
At the other end of the spectrum, the 2003 heat wave in Europe was the hottest summer on record for hundreds of years, and reduced maize yields in France and Italy by 30-35% (32) as a result of the increased heat and drought stress. The 2012 drought in the USA reduced maize yields by up to 25%, with even bigger impacts on exports (33).
Changing risks from crop pests and diseases
Pests and pathogens of agricultural crops are rapidly evolving and spreading around the world, posing an additional threat to food security alongside the climate and socio-economic challenges noted in the previous section (34).
Pest and pathogen pressures have existed since the dawn of agriculture. Archaeological evidence suggests that exportation of crops from their centres of origin may have temporarily reduced pest and disease pressures (35).
Similar challenges still exist in the present-day – for example through breeding resistant crop varieties and developing chemical controls which may eventually need further development to overcome rapidly evolving pests and diseases (36).
This is partly because selective breeding has tended to favour the convenience and productivity of genetically uniform domesticated varieties against the protection provided by high diversity and natural defence mechanisms found in wild crop ancestors (27).
Pests and pathogens comprise a diverse range of species with varying biologies (38).
The term ‘pest’ normally refers to insects and other arthropods that generally feed externally on plant tissues. An important example is the Colorado potato beetle that has swept across Eurasia since its introduction from the USA to France in 1922, and recently has reached the far east of Russia (39).
This highly adaptable insect has evolved resistance to pesticides and developed burrowing behaviour to survive cold winter conditions found outside its native range (40). The beetle has not yet established in the UK. Plant parasitic nematodes are also sometimes termed pests.
Many nematodes present a significant threat to crop production because they rapidly evolve resistance to chemical protection and many have very wide host ranges (41,42).
For example, the tropical root knot nematodes (genus Meloidogyne) appear to have spread to more temperate climates in recent years, and are very difficult to control. Pathogens are microbes such as bacteria, fungi and fungal-like oomycetes, along with non-cellular viruses and viroids, which invade plant tissues and thus have a close biological relationship with their hosts.
A recent example of a pathogen invader into the UK is the ash dieback fungus, thought to have been imported on nursery stock from the Netherlands (43).
There are growing numbers of reports on pests and pathogens of major food crops invading new regions.
A new syndrome known as maize lethal necrosis (MLN), which is probably spread by an insect vector, was first identified in Kenya in 2011, and appears to have spread to Mozambique, Uganda, Rwanda, Tanzania, and, most recently, in Democratic Republic of Congo (44).
Other new pest and pathogen threats for maize include the spread of Goss’s Wilt to Minnesota (USA) and Manitoba (Canada) from Nebraska and surrounding states, Maize Rough Dwarf Virus in Uganda and Kenya, and Stewart’s Wilt to Argentina.
Virulent new pathogen strains affecting key staple crops are also frequently reported. For example, resistance to strobilurin fungicides has been detected in Septoria Tritici Blotch (STB) of wheat in the UK, Australia and New Zealand.
Weather exerts a strong influence on crop pests and diseases. For example, the first outbreak in several decades of Puccinia graminis f. sp. tritici (cereal stem rust) in Germany was related to warm weather in 2013.
As well as affecting crop yields, climate warming over the twentieth century has shifted climate zones away from the equator, which has altered the distribution of plant species to maintain their favored climates (45). Observations appear to show that pests and pathogens may also have shifted their distribution (38).
Bioclimatic mathematical models of species distributions attempt to determine species’ temperature and moisture requirements from known distributions, or by experiment, and then use these preferences to estimate potential future distributions based upon climate projections (46,47,48,49).
Although the resulting maps of future suitability for pest activity must be treated with caution because of the uncertainty in both the climatic tolerances of species and the climate projections, they generally suggest that pests and pathogens are likely to move to higher latitudes (Fig. 4, (38)).
More generally, IPCC (10) concluded that the distribution of pests and diseases is likely to change due to future climate change, though low confidence was ascribed to this conclusion.
As an example, the UK lies at a high latitude, and can therefore expect further establishment of invasive exotic pests from the warmer south as the climate changes.
Producing a synthetic assessment of likely pest and disease impacts is difficult, not least because of the large range of different species and environments involved. There are several additional challenges in making future projections of pest and pathogen distributions.
First, for groups such as fungi and bacteria, infection of plants is highly dependent upon moisture, particularly the duration of leaf wetness during the growing season (50), and the global water cycle remains difficult to model (51). This is particularly the case at very small spatial scales relevant to pest and pathogen impacts such as an individual field, or even at plant level.
Second, pests and pathogens are able to adapt to new climates. For example, the fungus causing STB of wheat leads to losses of almost 1 billion in Germany, France and the UK alone and accounts for 70% of the EU spend on fungicides (S. Gurr, unpublished data).
STB thrives in humid climes, such as the northern EU’s “maritime zone”, but has shown rapid adaptation to temperature variation across its global range (52). It has become the dominant pathogen of wheat in temperate climates, taking over from a closely-related fungus (Parastagonospora nodorum) in recent years (53).
Third, there is a need to model not only the suitable habitat in terms of climate, but also where the host crops are likely to grow, and the likely transmission routes for spread. Crop production is affected not only by changes in climate, but also by socioeconomic factors such as demands for biofuel production.
The likely transmission routes can be estimated from trade data (54) but uncertainty in the global distributions of pests and pathogens makes this difficult, particularly in the developing world where monitoring is poor (55).
There may also be other climatic impacts beyond establishment risk. For example, warming can allow increased numbers of generations in the growing season, potentially increasing the opportunity for evolution of resistance to pesticides.
As an island, the UK has the advantage that borders are somewhat more controlled. For example, the recent import ban on fresh produce from India was driven by repeated interceptions of quarantine pests. In contrast, the entry of ash dieback in nursery stock illustrates the need for improved monitoring for pathogens.
At present, UK plant defence strategy is developing new protective genetics and chemistry, while pests and pathogens evolve countermeasures. This strategy will come under increasing pressure as the threats from pests and pathogens change, particularly as climate change alters survival rates of more exotic invasive species.
Tools to support global food security: bringing together climate projections, crop models, plant breeding and genetics
Genetic Tools to Support Plant Breeding in a changing climate
The first successful plant genetic modification (GM) experiments in 1983 (56,57) met with enthusiastic responses from the plant science and plant breeding communities.
These new tools made it possible to study the effects of individual genes, to transfer single genes into elite crop strains (rather than mixing two genotypes as in classical breeding), to by-pass sterility barriers and to look much more widely in the search for useful genetic traits.
However, the commercialization of GM crops in the mid-1990s was met with strong opposition, especially in the UK and in the rest of the EU (58,59).
This opposition delayed the uptake of GM crops into agriculture, and led to greater expenses in developing new GM varieties. For example, only one GM crop used for animal feed (maize MON 810) is currently grown commercially in the EU.
However, the European Parliament has recently approved new legislation on GM crops which will give governments more power to decide whether to grow GM crops.
Nevertheless, in 2014 GM crops were grown in 28 countries on a total area of 181.5 million hectares (60), and some GM crops are bringing positive benefits to agriculture in poorer countries (58,60,61). But can GM and associated techniques help in the challenge of feeding a growing population in a changing climate?
Breeding for a Changing Climate
Plant breeding has often been aimed at crop traits that result from the expression and interaction of many genes (‘quantitative trait loci’/QTLs) such as yield, usually for specific agri-environments, plus a small number of more specific traits such as virus-resistance.
Breeding programmes may also have led to the loss of adaptation to environmental stresses. On the other hand, molecular breeding based on GM techniques has focused on individual genes (or ‘stacks’ of two or three individual genes) and the traits they encode, including herbicide-tolerance, insect-resistance and virus-resistance.
The changing climate presents several different challenges for plant breeding (62).
First, there is the need to enhance tolerance of/adaptation to environmental stresses while maintaining yield as far as is possible. Second, the existence of alleles associated with tolerance in current elite strains needs to be assessed.
Third, wider ranges of genetic variation need to be exploited including land-races and traditional varieties, wild relatives and, for direct GM techniques, any relevant genes wherever they occur.
Genetic Tools
Genetic modification
GM techniques have come a long way since the 1983 experiments.
Much more is known about the molecular details of the process (e.g. 63). Integration into specific sites in the genome is possible (64).
Sophisticated regulatory and targeting mechanisms mean that gene expression can be controlled in developmental time and organismal/cellular space. This includes the ability to down-regulate genes very precisely using RNAi techniques (e.g. ref 65).
Specific genes have been identified that confer at least a degree of tolerance to particular stresses. For example, a maize (corn) variety, carrying a gene from Bacillus subtilis that encodes an RNA chaperone, performs better under drought stress (Fig. 5, 66) than non-transgenic control plants (although not as well as when well watered).
This variety was grown commercially for the first time in 2013. Similarly, a gene from sunflower that encodes a stress-responsive transcription factor confers a degree of drought stress-tolerance on soya bean (67, 68), which otherwise, has very high water requirements.
In dry regions such as Southern Europe, future increases in intense rainfall events and increased irrigation demands may cause greater soil salinisation due to greater water loss past the crop root zone (69). The gene TmHKT1;5-A encodes a sodium transporter and confers salt-tolerance on einkorn wheat (Triticum monococcum).
This wheat species will not hybridize with either pasta wheat (T. durum) or bread wheat (T. aestivum). However, via a series of plant breeding procedures that took 15 years, Munns et al., (70) used ‘conventional’ breeding to transfer the gene into T. durum.
Wheat plants with the transgene suffered much less effect on yield when exposed to high NaCl (salt) concentrations than did control plants.
It would have been quicker to transfer the gene by GM techniques than by ‘conventional’ breeding, but such a transfer would have been ‘subject to the restrictions associated with genetically engineered material.’
This is an example of how GM techniques could provide more rapid climate adaptation solutions than conventional plant breeding.
On the other hand, not all GM-related crop developments will provide direct benefits in a changing climate. For example, it is claimed, albeit by a group opposed to GM technology, that yields of Round-up-Ready soya bean are more affected by water deficit than are yields of ‘conventional’ varieties (71).
Marker-assisted selection
Marker-assisted selection (MAS) has been part of the plant breeder’s tool kit for over 60 years.
MAS involves identifying an easy-to-find genetic marker that is closely linked to a wanted allele that encodes or regulates a desirable trait. At first, the loci used as informative markers were often involved in regulating or encoding obvious external phenotypic characters.
For example, in 1935 Rasmusson used pea flower colour as a linked marker for a flowering time QTL (72). However, the advent of techniques for determining the distribution of DNA sequence motifs, ranging from RFLPs via micro-satellites to single-nucleotide polymorphisms has brought greater speed and reliability to MAS.
MAS is faster because the breeder does not have to wait for the appearance of the marker trait. It is also more reliable because a much greater density of markers can be achieved, and therefore much more closely linked markers than are usually available, if the marker is based on a coding sequence with a visible phenotype.
Genomics
DNA sequencing technology has advanced considerably since its inception in the late 1970s; sequencing a genome is now very much faster and cheaper (73).
High density marker maps can now be assembled not only for elite strains but also for traditional varieties, land-races and even wild relatives.
Through genome-wide associative analysis, this also provides a tool to search for as yet undiscovered alleles, especially alleles associated with resilience to environmental stresses (62).
While some newly discovered alleles may be introgressed into appropriate strains and cultivars by conventional breeding, others, especially those located in wild relatives or in unrelated species, will require the use of GM technology.
Genetic tools can potentially provide farmers and growers extra capability to produce more, use lesser inputs and avoid negative impacts on the environment, alongside the use of technology to improve input use efficiency and best practices.
It will be difficult to face the perfect storm with an incomplete tool kit (59, 74).
Using climate information in crop breeding programmes
Crop varieties are bred for particular environmental conditions.
Genotype by environment interactions (GxE) is an important issue in plant breeding, and given the long timescale of crop breeding cycles (5-20 years), it would be beneficial to understand future environmental changes so that breeding programmes can ensure suitability for both the current and future (time of release) climates.
In general, yield data generated from crop breeding and evaluation programmes arise from a series of field trials known as multi-environment trials (MET) which allow the investigation of varietal performance across a range of environmental conditions.
For example Ober et al. (75) genotyped 135 lines using 11 diagnostic markers plus seven markers based on published QTL data to understand the drought tolerance of a wide range of wheat varieties in the UK.
Characterisation of the crop environment using external (e.g. climate) data can help to explain GxE.
The crop breeding cycle
Fig. 6 demonstrates a typical crop breeding cycle focused on UK wheat, although in practice this will vary depending on the crop and the techniques being used in breeding.
The timescales shown represent a reasonable timeline given infrastructure to fast-track the process of backcrossing, while the fastest timelines are achievable with Doubled Haploids, which are not yet feasible with all crops.
Climate information and climate conditions will have different implications in different stages of the breeding process.
The generic stage plan shown here (Fig. 6) would be used across a group of projects in a crop breeding team to help visualize progress in the series of product candidates.
A crucial starting point is a clear definition of success criteria in the product profile at the outset. When creating a product profile crop breeders aim to address current concerns and requirements from farmers while balancing this against perceived future needs.
In the UK, these requirements will include the agronomic properties measured by the Home Grown Cereals Association (HGCA) such as yield and disease resistance, plus the processing industry requirements, and also the risk associated with weather extremes, particularly drought and heat stress.
For example, climate change will be one factor that could increase the importance of abiotic stress as a value adding trait.
The product profile could be to increase yield under drought or heat stress (relative to the controls) without any negative impact on yield under normal conditions.
A critical activity would therefore be to identify genes associated with the drought or heat stress trait, and bring them into the breeding programme.
Once a product profile is developed, the number of candidates is progressively reduced through single location, and later multi-location trails representing the main growing areas in the UK.
The varieties launched will also need to be tailored to the local conditions. The multi-location trials therefore implicitly include local climate as well as performance on the predominant soil types.
The National List (NL) trials represent the scale up in availability of seed to extend the scope of the trials to different parameters and multiple locations.
The NL trails are designed to produce enough data for the new variety to be recognized by partners and important customer groups (e.g. for wheat: National Institute of Agricultural Botany, millers, brewers and bakers).
Since wheat is used in a range of processing industries, it needs to have the right properties for specific applications. The Recommended List (RL) trials then aim for inclusion on the HGCA recommended list, which is almost essential for commercial success.
Farm advisors and farmers will select their varieties based on their own experience and the data comparisons offered on the RL.
Integrating environmental data into breeding programmes
There are currently various approaches for integrating environmental data into breeding programmes, to integrate both current and future conditions.
The two most common approaches are a) using climatological and other environmental data together with yield trial data for subdividing crop growing areas into Mega Environments (MEs) and b) using crop simulation models (to incorporate changing conditions) in defining a location and to characterise the target population of environments (TPE).
This is a mixture of environments expected for the intended region of production (76).
a) Using climatological, environmental and yield data to define Mega Environments
An example is the Mega Environments (MEs) from the International Maize and Wheat Improvement Center (CIMMYT), where ~800 testing sites were geo-referenced and classified according to predominant ME by wheat (77) and maize (78) scientists.
Then underlying climatic and edaphic factors (soil characteristics) were extracted and used to determine quantitative criteria for mapping the MEs. A limitation is the static definition of MEs (77).
They do not include a temporal aspect to define locations or regions in terms of probability or frequency of occurrence of different environment types. Some locations may fluctuate between multiple MEs depending on seasonal conditions (79).
Ortiz et al., (80) looked at wheat ME zonation in the Indo-Gangetic Plains (IGPs) and how the zonation may change by 2050 as a result of possible climatic shifts.
The study was based on a doubling of CO2 using data from the CCM3 climate model downscaled to high resolution. They found that the currently favourable wheat growing area which accounts for 15% of global wheat production might be reduced by as much as 51% by 2050 owing to early and late season heat stress.
On the contrary the cool temperate wheat-cropping systems might shift northwards from 55°N to 65°N.
b) Using modelling tools to define Target Population of Environments (TPE)
Using modelling tools offers the opportunity to characterize the TPE and to consider possible changes in the frequency of different stress patterns in current and future conditions.
The approach is powerful if yield is limited by a few major stresses only. Chapman et al. (81) used a crop simulation model with long-term weather records to determine seasonal sequences of drought stress for sorghum in Australia and grouped them into environmental types with specific stress patterns.
They found that the frequency of sorghum drought stress patterns within a normal 2-year MET often did not match that of the complete set of environments due to inter-annual climate variation.
As a result, the genotype average from a 2-year MET can be a poor estimate of the long-term performance of a genotype.
The estimate can be improved if the data were weighted according to their representativeness of the MET in the TPE (81) and therefore the revised estimate can assist the interpretation of the GxE for yield (82).
Informing current and future breeding requirements
Forecasting information for the mid-term (e.g. 20 years) by predicting the main climatic onditions, potential pest and disease pressure and growing season length, can help breeders to esign experiments to focus on genetic variability in the environments of interest.
Additionally, such information could potentially help in the choice of trial locations, and in determining whether they cover the climate of the main growing regions.
Some studies have taken the approach further to study breeding-simulation scenarios which link phenotypic consquences to changes in genetics via stable associations with crop model parameters.
These are studies to explore GxE interactions for complex traits. Examples of this approach are given by (83) for drought stress of maize in Australia, (81) for drought stress in sorghum in Australia,(84) for drought stress of wheat in Europe and (85) of maize in Europe.
Studies such as thee have been used to infer priorities for crop breeding in a changing climate.
For instance Semenov (86) and Semenov and Shewry (87) propose focusing on wheat varieties tolerant to high temperature rather than to drought.
Yet, if the supporting studies investigate only a small range of future environmental stresses they may be inadequate.
In addition, it is important to understand the different sources of uncertainties inherent in future crop impact assessents, particularly those related to high temperature events and model calibration (Fig. 7; 88)
Zheng et al. (89) and Harrison et al. (85) demonstrate how the same approach can be used to inform breeding for changing future conditions.
Zheng et al. (89) analyzed patterns of frost and heat events across the Australian wheat belt based on 50 years of historical weather station records and eight future scenarios, simulating three contrasting maturity wheat varieties.
They found that by 2050 both last frost and first heat events occur earlier in the season and shift the target sowing and flowering windows by up to 2 and 1 month(s).
They conclude that early sowing and longer season varieties would be the best strategies to adapt to future climates and point out that the 5-20 year process of breeding for new varieties needs to accelerate to adapt to future climate.
In turn, this indicates that skilful decadal climate forecasts (e.g. 90) would be of significant value to crop breeders.
Harrison et al. (85) characterised the typology and frequency of drought stress for maize in Europe and their associated yield distributions, and simulated the influence of three different breeding traits on yield under current and future climates.
They found that the same four drought stress patterns experienced today will be the most dominant ones in 2050; only their frequencies will change.
Traits having a positive effect on yield for one drought stress pattern do not necessarily have positive effects on a different drought stress pattern.
This shows that drought stress patterns which do not change in the future have important implications for breeding.
Otherwise breeding would need to be conducted under controlled-stress environments in order to account for the change in drought stress patterns.
Note that here, drought stress patterns are defined as water limitations to the crop during different developmental stages and of different severity, using a simulated water stress index and grouping simulations into categories (e.g. later water stress, early water stress, no water stress).
Although generic assessments of future changes in hydrological and meteorological drought occurrence are available (e.g. 17,18), these are rarely tailored to agricultural applications or crop-specific impacts, and do not directly relate to crop drought stress patterns.
Approaches based on crop models can only study a limited number of genotypes, because a large number of parameters need to be measured in order to determine model parameters for each genotype.
Another approach is to use crop modelling as a tool to perform a physiological integration of environmental data in order to derive stress covariates (environmental variables such as temperature which can be used to predict crop responses like heat stress; 91-94).
The approach has good potential if yield cannot be explained by a few major stresses as above (94). In order to include weather data in an interpretable way, reduce the number of variables, and accommodate non-linear responses.
Stress covariates can be defined by crop development stage (91-94). A crop model is then used to determine crop phenology – ideally for each genotype in each environment.
As this is often not feasible, it is common to divide MET data into sets of maturity types and to calibrate a crop model to common varieties that fall into those maturity types (94-96).
This approach makes the assumption that the stress response genetic architecture is the same among genotypes at a given developmental stage.
Heslot et al. (94) explicitly modelled whole-genome markers and their differential response to the environment using stress covariates to understand the genetic architecture of GxE for winter wheat in France.
A clear picture emerged about the stresses creating the most GxE, but no correlation between the importance of the marker and their main effect on yield could be found.
As none of the considered multiple stresses was suspected to be the main cause of GxE, it was not meaningful to directly use the stress covariates to group environments as has been done in previous studies (81,97,98).
The alternative approach is to group environments using the predicted GxE response, which is of direct interest for crop breeding because it allows grouping on the level of genetic correlation between environments.
However, a large and broad sample of environments types is needed for this method to be effective.
Bridging the gap – Other climate adaptation measures
It is clear that the crops of the future will be growing under changing climatic conditions.
Crop breeding and GM techniques can potentially help avoid some of the negative impacts and make the most of potential positive effects of climate change.
However, for future food security, a broader range of other adaptation measures, such as changes in agricultural technology and management techniques are also required.
There are two broad approaches for evaluating climate adaptation options (99): ‘top-down’ and ‘bottom-up’.
The top-down approach starts with the question: “how will future climate change?” (100), and is driven by information from climate models, future scenarios and the resulting impacts; the final stage is to design and assess “on the ground” adaptation options.
The bottom-up approach begins with the decision-making context (101-103), starting by identifying vulnerabilities, sensitivities, and thresholds to proposed adaptation measures.
These measures and their timing are then assessed against present and future drivers, including climate. These two approaches have different merits (104) – for instance top-down approaches are appropriate when uncertainties are shallow, while bottom-up approaches are more applicable when uncertainties are deep.
Bottom-up approaches also need information providers to work closely with decision makers (105) to understand their needs which can be very effective, but often need to be tailored to each decision context (106,107).
An important component of making robust assessments relevant to adaptation (108,109) is a comprehensive understanding of the uncertainties. Scientists and decision-makers may interpret uncertainty ranges differently, potentially resulting in poor decision making (104).
The appropriate treatment of uncertainty ranges may also vary according to the nature of adaptation required. In agriculture, adaptation could mean: coping (altering planting dates or crop varieties), adjusting (new crops), or transforming (new production systems, livelihoods, migration).
Top-down approaches are important for transformative strategies (110), while bottom-up approaches are useful for incremental (coping) strategies. Different kinds of climate information are also required for these different strategies – for instance, shorter-term information such as seasonal forecasts are particularly relevant to coping strategies, while longer-term multi-decadal climate projections are necessary for assessing transformative strategies (110).
Olesen and Bindi (111) also note the need for both short-term and long-term structural and policy changes to support agricultural adaptation.
Recent global-scale analyses suggest there could be considerable positive benefits of adaptation measures – for example, adaptation could result in future yields of major crops that are higher than their no-adaptation counterparts by the equivalent of 7–15% of current yields, with greater benefits for wheat compared to maize (Fig. 8, (15)).
There are also examples of present-day adaptation to changing climate. Liu et al. (112) found that maize yields in Northeast China had increased between 1981 and 2007, under changes in climate, cultivar selection and crop management.
Earlier sowing and the introduction of cultivars with higher thermal time requirements appear to have overcome the negative effects of the changing climate, turning a potential yield loss into a significant increase.
However, it is unclear when farmers decided to plant their crops earlier, and whether this was influenced by weather-related factors.
Extreme weather events and climate variability can be particularly challenging for agriculture, as farmers can often adapt to more gradual changes, but managing the impacts of extreme events is much more difficult. This is particularly the case where opposite extreme weather events occur in close succession.
In the UK, for example, March 2012 was the fifth driest and third warmest March on record, followed by the wettest April on record in the UK.
It is also difficult to allow for the impacts of extreme weather events in crop breeding programmes because the focus tends to be on maximum yield, and stability of yield rather than for unusual conditions.
Early warning systems and seasonal forecasts which incorporate extreme events and their impacts on crops could therefore be beneficial tools to support coping strategies (113).
For example, given appropriate prior information on the probability of a drought or heat stress event on the coming season, farmers could plant more resistant varieties which would yield less under normal conditions.
Seasonal climate information could also help farmers to plan ahead more generally, supporting decisions on crop type, variety and to plan field operations (e.g. cultivation to reduce soil damage, fertilizer application to minimize leaching or emission-related losses).
Agrochemical companies could also potentially benefit from seasonal to annual weather forecasts linked to pest, weed and disease pressure to plan and manufacture appropriate amounts of products ahead of the season.
Seasonal climate forecasts have found fairly widespread user applications in some regions of the World, notably Africa, the USA and Australia (114,115), but there has been relatively little uptake in Europe (114).
This is partly driven by the relatively limited skill of seasonal climate forecasts in Europe (116-118); if farmers were to rely on these forecasts to make planting choices, these could result in poor results with negative economic impacts.
Rather than technical aspects (e.g. accuracy, lead time, and spatial/temporal scale, 119) potential economic and environmental benefits may be the dominant drivers of user uptake of seasonal forecasts.
An additional challenge is that seasonal predictions are commonly uncertain, which brings additional challenges in communicating forecast information to end-users (113).
A range of practical adaptation options is available to farmers. In the UK, for instance (21) these could include:
* improved soil and water management (residue management, water harvesting, on-farm storage),
* improved irrigation techniques,
* changing crop types, varieties, and sowing dates, and,
* other measures such as planting trees to provide shading and windbreaks.
Summary and future directions
The growing population and changing climate are likely to put increasing pressure on agriculture to produce more food on less land, with lower inputs and lower impacts on the environment.
The changing climate could directly affect yields of major food crops, with the impact varying, depending on the crop and region.
There will be changing patterns of threats from pests and pathogens.
There are several tools which could help in meeting this challenge, including conventional breeding, and GM assisted breeding, significantly accelerating the breeding process.
Climate information could potentially inform more focused development and application of these tools in a number of ways.
While current crop breeding programmes do not always explicitly incorporate current or future climate information, doing so could potentially deliver more resilient varieties through a better understanding of sensitivity to present climate, and greater future resilience.
Examples of traits which could directly link to climate-related information include resistance to heat and drought stress.
However, breeding may also need to account for a wider range of factors (and their combinations/interactions) such as water-logging/flooding, changing pest and disease pressures, changes in atmospheric chemistry (e.g. ozone, carbon dioxide), and potentially salt tolerance.
Climate information relevant to these traits (e.g. present and future climatologies) could provide a key input in the first step of a new crop breeding programme: defining the success criteria, or breeding target.
The later phases of a crop breeding programme typically involve testing crop performance across a range of different sites. Weather and climate information could potentially benefit these stages of the breeding process in several ways.
Weather data collected at trial sites could be analysed alongside crop performance statistics – for example to assess which weather extremes were experienced and inform subsequent selection of varieties.
The choice of trials sites could be informed through use of tailored present-day and future climatologies, and skillful decadal forecasts would be particularly valuable in this respect.
This emphasizes the importance of defining appropriate, user-focused measures of reliability for such forecasts, and the need for clear information on their current and anticipated future reliability.
Testing crop suitability for future climates may also require trialing crops in a wider range of climate zones than is done at present, or making use of controlled environments, whilst recognizing that a range of other factors will differ across sites (e.g. soil type, pest and disease pressures).
Appropriate methods should be chosen for incorporating climate information into crop breeding programmes, depending on both the specific needs of the breeding programme, and on the strengths and weaknesses of available approaches.
For example:
* Combining climate, environmental and yield data to define MEs provide useful coarse-scale information, but this has a number of limitations, such as lack of both a temporal aspect (e.g. incorporating future climate changes) to define locations, and of probabilities of different types of environment).
* The use of modelling tools to define TPEs is only recommended where yield is limited by a few major stresses.
* Using crop models to integrate environmental data and derive stress covariates may be a better choice where yield is limited by many stresses.
Alongside crop breeding techniques, a range of practical adaptation options is also available to the farmer, providing complementary ways to cope with the changing climate; adopting well chosen adaptation measures could potentially provide significant benefits.
Appropriate approaches for assessing and evaluating adaptation options will lead to more robust decision making.
In the context of this paper, bottom-up approaches could be particularly important for designing near-term (coping) adaptation options in agriculture; a blend of top-down and bottom up approaches may be suited to informing the ‘adjusting’ nature of crop breeding programmes.
Seasonal forecasts, and related early warning systems tailored to agricultural applications could provide significant benefits in near-term adaptation.
There are, however, several challenges in delivering such early warning systems, such as variable forecast reliability depending on the region of the world, and effective communication of probabilistic forecasts to users.
In addition, integrated provision of agriculture-relevant weather and climate forecast information across timescales (e.g. days to decades) could support better decision-making, rather than provision through separate channels/sources as is mainly done at present.
In order for climate information to be usable in agriculture, it needs to be provided at the right time, in the right format, and to be actionable (120).
In turn, to be actionable (121), climate information must be salient (perceived relevance), credible (perceived technical quality) and legitimate (perceived objectivity of the process by which the information is shared).
In the context of this article, it is particularly important to gain a better understanding of the thresholds of importance to users. For instance, the outcomes of weather and climate science could be better tailored towards crop breeding programmes using knowledge of the frequency, occurrence and severity of extreme climate events that could be included in the product profile.
More relevant information on the impacts of changes in climate variability and extremes would therefore be particularly beneficial. Extreme climate event analyses may also need to be better tailored to crop breeding programmes (e.g. expressed in terms of impact on crop growth and development, rather than as rainfall or soil moisture deficits).
An important issue here is that of spatial scale: understanding the spatial scales at which robust climate information can be provided, and how this relates to the current scales of breeding programmes (e.g. MEs, TPEs).
A particular challenge for translating climate science into actionable outcomes for agriculture is the effective communication of the uncertainties (114) , which are an inherent part of climate and impact projections.
Figure 9 (from 109) illustrates how the information from uncertain climate impact projections could potentially be enhanced – for example, using “detectable”, or predictable signals in crop yields where they exceed the total uncertainty.
Furthermore, Figure 9 demonstrates that decadal mean yields are predictable for a more heat-tolerant crop (with adaptation), but not for a crop that is susceptible to heat stress (without adaptation).
This is because increases in extreme heat stress increase the interannual variability of yield, and therefore lead to greater overall uncertainty for non-heat tolerant crop yields Note that in this case, adaptation lowers the total uncertainty (solid black line) in future yield changes, although the actual yield change (dashed black line) is actually greater with temperature adaptation.
Several more specific future research needs are outlined below. Firstly, to deliver GM techniques (and conventional breeding outcomes) in support of food security in a changing climate, a more detailed understanding of the patterns and timing of biochemical and physiological responses to stresses across different crop types is needed (122).
In turn, this requires an understanding of the relative importance of individual components of the response pathways (123) and the genes involved in their regulation.
Better information is needed on the networks of regulatory elements associated with a range of environmental stresses (such as those currently under investigation in Arabidopsis (124)). Secondly, changes in future pest and disease pressures are particularly uncertain.
Management methods which recognize the ecological and evolutionary principles behind pest and pathogen migration and evolution are therefore also needed to ensure future food security.
There is significant potential for strong collaboration between different scientific disciplines (e.g. climate science, crop science, pathogen biology, and plant genetics) and the agricultural industry (e.g. both growers and breeders) to deliver more resilient solutions for future food security in a changing climate.
More broadly, because of the wide-ranging implications of crop breeding for a changing climate, further work should explore relevant social and economic assumptions such as the level and distribution of real incomes, changing consumption patterns, health impacts, impacts on markets and trade, and the impact of legislation relating to conservation, the environment and climate change.
Acknowledgements
This article was supported by the Joint DECC/Defra Met Office Hadley Centre Climate programme (GA01101) and the EUPORIAS project, funded by the European Commission 7th Framework Programme for Research, grant agreement 308291
References
1. UN (2013) World Population Prospects: The 2012 Revision, Highlights and Advance Tables..ESA/P/WP.228, United Nations, Department of Economic and Social Affairs, Population Division, New York, USA.
2. NIC (2012) Global Trends 2030: Alternative Worlds. The National Intelligence Council, Washington, USA.
3. IPCC, 2013: Summary for Policymakers. In: Climate Change 2013: The Physical Science Basis. Contribution of Working Group I to the Fifth Assessment Report of the Intergovernmental Panel on Climate Change (Stocker, T F, Qin, D, Plattner, G-K, Tignor, M, Allen, S K , Boschung, J, Nauels, A, Xia, Y, Bex, V & Midgley, P M (eds.). Cambridge University Press, Cambridge, United Kingdom and New York, NY, USA.
4. Mahlstein, I, Knutti, R, Solomon, S & Portmann, R W. (2011) Early onset of significant local warming in low latitude countries. Environ. Res. Lett., 6, 034009.
5. FAOSTAT (2015) FAOSTAT: Database of the Food and Agriculture Organisation of the United Nations, Statistics Division. http://faostat3.fao.org accessed 11/02/2015.
6. Ewert, F, Rounsevell, M D A, Reginster, I, Metzger, M J, & Leemans, R (2005) Future scenarios of European agricultural land use: I. Estimating changes in crop productivity. Agriculture, Ecosystems & Environment, 107, 101–116. doi:10.1016/j.agee.2004.12.003
7. Brisson, N, Gate, P, Gouache, D, Charmet, G, Ouryc, F-X, & Huarda, F (2012) Why are wheat yields stagnating in Europe? A comprehensive data analysis for France. Field Crop. Res., 119, 201–212.
8. Ray, D K, Ramankutty, N, Mueller, N D, West, P C, & Foley, J A (2012) Recent patterns of crop yield growth and stagnation. Nature Communications, 3, 1293 doi:10.1038/ ncomms2296.
9. Porter, J R & Semenov, M A (2005) Crop responses to climatic variability. Phil. Trans. R. Soc. B, 360, 2021–2035, doi:10.1098/rstb.2005.1752
10. Porter, J R, Xie, L, Challinor, A J, Cochrane, K, Howden, S M, Iqbal, M M, Lobell, D B, & Travasso, M I. (2014) Food security and food production systems. In: Climate Change 2014: Impacts, Adaptation, and Vulnerability. Part A: Global and Sectoral Aspects. Contribution of Working Group II to the Fifth Assessment Report of the Intergovernmental Panel on Climate Change (Field, C B, Barros, V B, Dokken, D J, Mach, K J, Mastrandrea, M D, Bilir, T E, Chatterjee, M, Ebi, K L, Estrada, Y O, Genova, R C, Girma, B, Kissel, E S, Levy, A N, MacCracken, S, Mastrandrea, P R, & White, L L (eds.). Cambridge University Press, Cambridge, United Kingdom and New York, NY, USA, pp. 485-533.
11. Asseng, S, Ewert, F, Martre, P, Roetter, R P, Lobell, D B, Cammarano, D, Kimball, B A, Ottman, M J, Wall, G W, White, J W, Reynolds, M P, Alderman, P D, Prasad, P V V, Aggarwal, P K, Anothai, J, Basso, B, Biernath, C, Challinor, A J, De Sanctis, G, Doltra, J, Fereres, E, Garcia-Vila, M, Gayler, S, Hoogenboom, G, Hunt, L A, Izaurralde, R C, Jabloun, M, Jones, C D, Kersebaum, K C, Koehler, A-K, Mueller, C, Naresh Kumar, S, Nendel, C, O'Leary, G, Olesen, J E, Palosuo, T, Priesack, E, Eyshi Rezaei, E, Ruane, A C, Semenov, M A, Shcherbak, I, Stoeckle, C, Stratonovitch, P, Streck, T, Supit, I, Tao, F, Thorburn, P J, Waha, K, Wang, E, Wallach, D, Wolf, J, Zhao, Z, & Zhu, Y (2014) Rising temperatures reduce global wheat production, Nature Climate Change, doi: 10.1038/nclimate2470
12. Osborne, T M & Wheeler, T R (2013) Evidence for a climate signal in trends of global crop yield variability over the past 50 years. Environ. Res. Lett., 8, 024001.
13. Rosenzweig, C, Elliot, J, Deryng, D, Ruane, A C, Muller, C, Arneth, A, Boote, K J, Folberth, C, Glotter, M, Khabarov, A C, Neumann, K, Piontek, F, Pugh, T A, Schmid, E, Stehfest, E, Yang, H, & Jones, J M (2014) Assessing agricultural risks of climate change in the 21st century in a global gridded crop model intercomparison. P. Natl. Acad. Sci., 111, 3268–3273, doi:10.1073/ pnas.1222463110.
14. Lobell, D B, Bänziger, M, Magorokosho, C & Vivek, B (2011) Nonlinear heat effects on African maize as evidenced by historical yield trials. Nature Climate Change, 1, 42–45. doi:10.1038/ nclimate1043.
15. Challinor, A J, Watson, J, Lobell, D B, Howden, S M, Smith, D R, & Chhetri, N (2014) A meta-analysis of crop yield under climate change and adaptation. Nature Climate Change, 4, 287-291.
16. Elliott, J, Deryng, D, Muller, C, Frieler, K, Konzmann, M, Gerten, D, Glotter, M, Florke, M, Wada, Y, Best, N, Eisner, S, Folberth, C, Fekete, B, Foster, I, Gosling, S, Haddeland, I, Khabarov, N, Ludwig, F, Masaki, Y, Olin, S, Rosenzweig, C, Ruane, A, Satoh, Y, Schmid, E, Stacke, T, Tang, Q, & Wisser, D (2014). Constraints and potentials of future irrigation water availability on global agricultural production under climate change. Proceedings of the National Academy of Sciences, 111, 3239-3244. doi:10.1073/pnas.1222474110.
17. Taylor, I H, Burke, E, McColl, L, Falloon, P D, Harris, G R, & McNeall, D. (2013). The impact of climate mitigation on projections of future drought. Hydrol. Earth Syst. Sci., 17, 2339–2358, doi:10.5194/hess-17-2339-2013.
18. Prudhomme, C, Giuntoli, I, Robinson, E L, Clark, D B, Arnell, N W, Dankers, R, Fekete, B M, Franssen, W, Gerten, D, Gosling, S N, Hagemann, S, Hannah, D M., Kim, H, Masaki, Y, Satoh, Y, Stacke, T, Wada, Y, & Wisser, D (2014). Hydrological droughts in the 21st century, hotspots and uncertainties from a global multimodel ensemble experiment. Proceedings of the National Academy of Sciences of the United States of America, 111, 3262-3267.
19. Dankers, R, Clark, D, Falloon, P, Heinke, J, Fekete, B M, Gosling, S, Masaki, Y, & Stacke, T (2013) A first look at changes in flood hazard in the ISI-MIP ensemble. Proc. Natl. Acad. Sci., 111, 3257–3261, doi: 10.1073/pnas.1302078110.
20. Gornall, J, Betts, R, Burke, E, Clark, R, Camp, J, Willett, K, & Wiltshire, A (2010) Implications of climate change for agricultural productivity in the early twenty-first century. Philos Trans R Soc B, 365, 2973?2989.
21. Knox, J W, Hurford, A, Hargreaves, L & Wall, E (2012) Climate Change Risk Assessment for the Agriculture Sector, Defra, London, UK.
22. Cho, K, Falloon, P, Gornall, J, Betts, R, & Clark, R (2012) Winter wheat yields in the UK: uncertainties in climate and management impacts. Climate Research, 54, 49-68, doi:10.3354/ cr01085
23. Foresight (2011), International Dimensions of Climate Change (London: Government Office for Science), http://www.bis.gov.uk/assets/ foresight/docs/international-dimensions/11-1042-international-dimensions-of-climate-change.pdf, accessed 11/02/2015.
24. Nelson, G C, Rosegrant, M W, Palazzo, A, Gray, I, Ingersoll, C, Robertson, R, Tokgoz, S, Zhu, T, Sulser, T B, Ringler, C, Msangi, S, & You, L (2010) Food Security, Farming, and Climate Change to 2050: Scenarios, Results Policy Options. International Food Policy Research Institute, Washington, D.C.
25. Nelson, G C, Valin, H, Sands, R D, Havlik, P, Ahammad, H, Deryng, D, Elliott, J, Fujimori, S, Hasegawa, T, Heyhoe, E, Kyle, P, Von Lampe, M, Lotze-Campen, H, Mason d'Croz, D, van Meijl, H, van der Mensbrugghe, D, Muller, C, Popp, A, Robertson, R, Robinson, S, Schmid, E, Schmitz, C, Tabeau, A, Willenbockel, D (2013) Climate change effects on agriculture: Economic responses to biophysical shocks. Proceedings of the National Academy of Sciences, 111, 3274-3279.
26. Jenkins, G J, Murphy, J M, Sexton, D S, Lowe, J A, Jones, P, & Kilsby, C G (2009) UK climate projections: briefing report. Met Office Hadley Centre, Exeter.
27. Met Office Hadley Centre (2014) Too hot, too cold, too wet, too dry: Drivers and impacts of seasonal weather in the UK. http://www.metoffice.gov.uk/media/pdf/4/8/Drivers_and_impacts_of_seasonal_weather_in_the_UK.pdf, accessed 11/02/2015.
28. Kendon, E J, Roberts, N M, Fowler, H J, Roberts, M J, Chan, S C and Senior, C A, (2014) Heavier summer downpours with climate change revealed by weather forecast resolution model. Nature Climate Change, 4, 570-576.
29. Falloon P D, & Betts, R A (2010) Climate impacts on European agriculture and water management in the context of adaptation and mitigation – the importance of an integrated approach. Science of the Total Environment, 408, 5667-5687.
30. GFS (2014), Insight Issue 2, February 2014 “Severe weather and UK food resilience” http://www.foodsecurity.ac.uk/assets/pdfs/1401-gfs-insight-severe-weather.pdf, accessed 11/02/2015.
31. Defra (2012) Department for Environment, Food & Rural Affairs: Structure of the agricultural industry dataset – UK cereal and oilseed area, yield and production. https://www.gov.uk/government/uploads/system/uploads/attachment_data/file/388517/structure-june-ukcerealoilseed-18dec14.xls. Accessed 12/02/2015.
32. Ciais, P, Reichstein, M, Viovy, N, Granier, A, Ogeé, J, Allard, V, Aubinet, M, Buchmann, N, Bernhofer, C, Carrara, A, Chevallier, F, De Noblet, N, Friend, A, Friedlingstein, P, Grünwald, T, Heinesch, B, Keronen, P, Knohl, A, Krinner, G, Loustau, D, Manca, G, Matteucci, G, Miglietta, F, Ourcival, JM, Papale, D, Pilegaard, K, Rambal, S, Seufert, G, Soussana, JF, Sanz, MJ, Schulze, ED, Vesala, T, Valentini, R (2005) Europe-wide reduction in primary productivity caused by the heat and drought in 2003. Nature, 437, 529-533. doi:10.1038/nature03972
33. USDA (2012) Feed Outlook No. (FDS-13L), December 13, 2013. Capehart, T, Allen, E, & Bond, J K. A Report from the Economic Research Service. http://www.ers.usda.gov/publications/ fds-feed-outlook. Accessed 12/02/2015.
34. Bebber, DP, Holmes, T, & Gurr, SJ (2014) The global spread of crop pests and pathogens. Global Ecology and Biogeography, 23, 1398–1407.
35. Dark, P, & Gent, H (2001) Pests and diseases of prehistoric crops: a yield “honeymoon” for early grain crops in Europe? Oxford Journal of Archaeology, 20, 59–78.
36. Mackay, I, Horwell, A, Garner, J, White, J, McKee, J, & Philpott, H (2011) Reanalyses of the historical series of UK variety trials to quantify the contributions of genetic and environmental factors to trends and variability in yield over time. Theoretical and Applied Genetics, 122, 225–238.
37. Rosenthal, JP, & Dirzo, R (1997) Effects of life history, domestication and agronomic selection on plant defence against insects: Evidence from maizes and wild relatives. Evolutionary Ecology, 11, 337–355.
38. Bebber, DP, Ramotowski, MAT, & Gurr, SJ (2013) Crop pests and pathogens move polewards in a warming world. Nature Climate Change, 3, 985–988.
39. Popova, EN (2014) The influence of climatic changes on range expansion and phenology of the Colorado potato beetle (Leptinotarsa decemlineata, Coleoptera, Chrysomelidae) in the territory of Russia. Entomological Review, 94, 643–653.
40. Izzo, VM, Hawthorne, DJ, & Chen, YH (2014) Geographic variation in winter hardiness of a common agricultural pest, Leptinotarsa decemlineata, the Colorado potato beetle. Evolutionary Ecology, 28, 505–520.
41. Jones, JT, Haegeman, A, & Danchin, EGJ et al. (2013) Top 10 plant-parasitic nematodes in molecular plant pathology. Molecular Plant Pathology, 14, 946–961.
42. Singh, SK, Hodda, M, Ash, GJ, & Banks, NC (2013) Plant-parasitic nematodes as invasive species: characteristics, uncertainty and biosecurity implications. Annals of Applied Biology, 163, 323–350.
43. Boyd, IL, Freer-Smith, PH, Gilligan, CA, & Godfray, HCJ (2013) The Consequence of Tree Pests and Diseases for Ecosystem Services. Science, 342, 1235773.
44. Adams, IP, Miano, DW, & Kinyua, ZM et al. (2013) Use of next-generation sequencing for the identification and characterization of Maize chlorotic mottle virus and Sugarcane mosaic virus causing maize lethal necrosis in Kenya. Plant Pathology, 62, 741–749.
45. Chen, I-C, Hill, JK, Ohlemüller, R, Roy, DB, & Thomas, CD (2011) Rapid range shifts of species associated with high levels of climate warming. Science, 333, 1024 –1026.
46. Bregaglio, S, Donatelli, M, & Confalonieri, R (2013) Fungal infections of rice, wheat, and grape in Europe in 2030–2050. Agronomy for Sustainable Development, 33, 767–776.
47. Kriticos, DJ, Morin, L, Leriche, A, Anderson, RC, & Caley, P (2013) Combining a Climatic Niche Model of an Invasive Fungus with Its Host Species Distributions to Identify Risks to Natural Assets: Puccinia psidii Sensu Lato in Australia. PLoS ONE, 8, e64479.
48. Berzitis, EA, Minigan, JN, Hallett, RH, & Newman, JA (2014) Climate and host plant availability impact the future distribution of the bean leaf beetle (Cerotoma trifurcata). Global Change Biology, 20, 2778–2792.
49. Sparks, AH, Forbes, GA, Hijmans, RJ, & Garrett, KA (2014) Climate change may have limited effect on global risk of potato late blight. Global Change Biology, 20, 3621–3631.
50. Bregaglio, S, Donatelli, M, Confalonieri, R, Acutis, M, Orlandini, S (2011) Multi metric evaluation of leaf wetness models for large-area application of plant disease models. Agricultural and Forest Meteorology, 151, 1163–1172.
51. Flato, G, Marotzke, J, Abiodun, B, Braconnot, P, Chou, SC, Collins, W, Cox, P, Driouech, F, Emori, S, Eyring, V, Forest, C, Gleckler, P, Guilyardi, E, Jakob, C, Kattsov, V, Reason, C & Rummukainen, M (2013) Evaluation of Climate Models. In: Climate Change 2013: The Physical Science Basis. Contribution of Working Group I to the Fifth Assessment Report of the Intergovernmental Panel on Climate Change (eds. Stocker, TF, Qin, D, Plattner, G-K, Tignor, M, Allen, SK, Boschung, J, Nauels, A, Xia, Y, Bex, V & Midgley, SK). Cambridge University Press, Cambridge, United Kingdom and New York, NY, USA
52. Zhan, J, McDonald, BA (2011) Thermal adaptation in the fungal pathogen Mycosphaerella graminicola. Molecular Ecology, 20, 1689–1701.
53. Bearchell, SJ, Fraaije, BA, Shaw, MW, & Fitt, BDL (2005) Wheat archive links long-term fungal pathogen population dynamics to air pollution. Proceedings of the National Academy of Sciences of the United States of America, 102, 5438–5442.
54. Bacon, SJ, Bacher, S, & Aebi, A (2012) Gaps in Border Controls Are Related to Quarantine Alien Insect Invasions in Europe. PLoS ONE, 7, e47689.
55. Bebber, DP, Holmes, T, Smith, D, & Gurr, SJ (2014b) Economic and physical determinants of the global distributions of crop pests and pathogens. New Phytologist, 202, 901–910.
56. Herrera-Estrella, L, Depicker, A, van Montagu, M, & Schell, J (1983) Expression of chimaeric genes transferred into plant cells using a Ti-plasmid-derived vector. Nature, 303, 209-213.
57. Fraley, RT, Rogers, SG, & Horsch, RB et al. (1983) Expression of bacterial genes in plant cells. Proceedings of the National Academy of Sciences, USA, 80, 4803-7.
58. Bryant, J, la Velle, L, & Searle, J (2015) Introduction to Bioethics, 2nd ed’n; Wiley-Blackwell, Chichester.
59. Trewavas, A, & Livermore, M (2014) GM is a valuable technology that solves many agricultural problems in breeding and generation of new traits. World Agriculture, 4, 60-67.
60. ISAAA (2015) Global Status of Commercialized Biotech/GM Crops: 2014 http://www.isaaa.org/resources/publications/briefs/49/executivesummary/default.asp. Accessed 12/02/2015.
61. Brookes, G, & Barfoot, P (2014) GM crops: global socio-economic and environmental impacts 1996-2012. PG Economics Ltd, Dorchester, UK.
62. Abberton, M, Batley, J, & Bentley, A et al. (2015) Application of genomics to the production of climate-resilient crops: challenges and opportunities. Submitted.
63. Ziemienowicz, A, Tinland, B, & Bryant, J et al. (2000) Plant enzymes but not Agrobacterium VirD2 mediate T-DNA ligation in vitro. Molecular and Cellular Biology, 20, 6317-22.
64. Da Ines, O, & White, CI (2013) Gene site-specific insertion in plants. In Site-directed Insertion of Transgenes, eds Renault S, Duchateau P; Springer, Dordrecht, Netherlands; pp 287-315.
65. Molnar, A, Bassett, A, & Thuenemann, E et al. (2009) Highly specific gene silencing by artificial microRNAs in the unicellular alga Chlamydomonas reinhardtii. Plant Journal, 58,165-174
66. Castiglioni, P, Warner, D, & Bensen, RJ et al., (2008) Bacterial RNA Chaperones Confer Abiotic Stress Tolerance in Plants and Improved Grain Yield in Maize under Water-Limited Conditions, Plant Physiology, 147, 446-455.
67. Cabello, JV, Arce, AV, Chan, RL (2012) The homologous HD-Zip I transcription factors HaHB1 and AtHB13 confer cold tolerance via the induction of pathogenesis-related and glucanase proteins. Plant Journal, 69, 141-153.
68. Cabello, JV, & Chan, RL (2012) The homologous homeodomain-leucine zipper transcription factors HaHB1 and AtHB13 confer tolerance to drought and salinity stresses via the induction of proteins that stabilize membranes. Plant Biotechnology Journal,10, 815-825.
69. van Ittersum, MK, Howden, SM, & Asseng S (2003) Sensitivity of productivity and deep drainage of wheat cropping systems in a Mediterranean environment to changes in CO2,temperature and precipitation. Agric Ecosys Environ, 97, 255–273.
70. Munns R, James RA, Xu B et al., (2012) Wheat grain yield on saline soils is improved by an ancestral Na transporter gene. Nature Biotechnology 30, 360-364.
71. Altieri M, & Pengue W (2006) GM Soybean: Latin America’s new colonizer Seedling Jan 2006, 13 – 17 http://www.grain.org/article/entries/588-gm-soybean-latin-america-s-new-colonizer . Accessed 18/02/2015.
72. Rasmusson, JM (1935) Studies on the inheritance of quantitative characters in Pisum: 1. Preliminary note on the genetics of flowering. Hereditas, 20, 161–180.
73. Edwards, D, Batley, J, Snowdon, R (2013) Accessing complex genomes with next-generation sequencing. Theoretical and Applied Genetics, 126, 1-11.
74. BBSRC (2013) Thirty years of plant transformation. http://www.bbsrc.ac.uk/web/FILES/Publications/plant-transformation.pdf. Accessed 12/02/2015.
75. Ober, E.S. (2012). Improving water use efficiency and drought tolerance in UK winter wheats. HGCA Final Project Report No. 476. http://www.hgca.com/publications/2013/october/09/improving-water-use-efficiency-and-drought-tolerance-in-uk-winter-wheats.aspx. Accessed 12/02/2015.
76. Comstock, RE (1977) Quantitative genetics and the design of breeding programs, Iowa State University Press, Ames.
77. Hodson, DP, & White, JW (2007) Use of spatial analyses for global characterization of wheat-based production systems. The Journal of Agricultural Science, 145, 115.
78. Bellon, M R, Hodson, D, Bervinson, D, Beck, D, Martinez-Romero, E & Montoya, Y (2005) Targeting agricultural research to benefit poor farmers: Relating poverty mapping to maize environments in Mexico. Food Policy, 30, 476-492.
79. Trethowan, R, Hodson, D P, Braun, H-J, Pfeiffer, W & Van Ginkel, M (2005) Wheat breeding environments. In: Lantican, MA, Dubin, HJ & Morris, ML (eds.) Impacts of International Wheat Breeding Research in the Developing World, 1988-2002. CIMMYT.
80. Ortiz, R, Sayre, KD, Govaerts, B, Gupta, R, Subbarao, GV, Ban, T, Hodson, D, Dixon, JM, Ivan Ortiz-Monasteria, J & Reynolds, M (2008). Climate change: Can wheat beat the heat? Agriculture, Ecosystems & Environment, 126, 46-58.
81. Chapman, SC, Cooper, M, Hammer, GL, & Butler, DG. (2000) Genotype by environment interactions affecting grain sorghum. II. Frequencies of different seasonal patterns of drought stress are related to location effects on hybrid yields. Australian Journal of Agricultural Research, 51, 209-222.
82. Chenu, K, Cooper, M, Hammer, GL, Mathews, KL, Dreccer, MF, & Chapman, SC (2011) Environment characterization as an aid to wheat improvement: interpreting genotype-environment interactions by modelling water-deficit patterns in North-Eastern Australia. Journal of Experimental Botany, 62, 1743-55.
83. Chenu, K, Chapman, SC, Tardieu, F, Mclean, G, Welcker, C & Hammer, GL (2009) Simulating the yield impacts of organ-level quantitative trait loci associated with drought response in maize: a "gene-to-phenotype" modeling approach. Genetics, 183, 1507-23.
84. Semenov, MA, Martre, P & Jamieson, PD (2009) Quantifying effects of simple wheat traits on yield in water-limited environments using a modelling approach. Agricultural and Forest Meteorology, 149, 1095-1104.
85. Harrison, MT, Tardieu, F, Dong, Z, Messina, CD & Hammer, GL (2014) Characterizing drought stress and trait influence on maize yield under current and future conditions. Global Change Biology, 20, 867-878.
86. Semenov, MA (2009) Impacts of climate change on wheat in England and Wales. Journal of the Royal Society, Interface / the Royal Society, 6, 343-50.
87. Sememov, MA, & Shewry, PR (2011) Modelling predicts that heat stress, not drought, will increase vulnerability of wheat in Europe. Scientific Reports, 1, Article number: 66, doi:10.1038/srep00066
88. Hawkins, E, Osborne, TM, Ho, CK, & Challinor, AJ (2013) Calibration and bias correction of climate projections for crop modelling: An idealised case study over Europe. Agricultural and Forest Meteorology, 170, 19-31.
89. Zheng, B, Chenu, K, Fernanda Dreccer, M, & Chapman, SC (2012) Breeding for the future: what are the potential impacts of future frost and heat events on sowing and flowering time requirements for Australian bread wheat (Triticum aestivium) varieties? Global Change Biology, 18, 2899-2914.
90. Smith, DM, Cusack, S, Colman, AW, Folland, CK, Harris, GR, & Murphy, JM (2007) Improved surface temperature prediction for the coming decade from a global climate model. Science, 317, 796-799, doi:10.1126/science.1139540.
91. Landau, S, Mitchell, RAC, Barnett, V, Colls, JJ, Craigon, J, Moore, KL, & Payne, R W (1998) Testing winter wheat simulation models' predictions against observed UK grain yields. Agricultural and Forest Meteorology, 89, 85-99.
92. Landau, S, Mitchell, RAC, Barnett, V, Colls, JJ, Craigon, J, & Payne, R W. 2000. A parsimonious, multiple-regression model of wheat yield response to environment. Agricultural and Forest Meteorology, 101, 151-166.
93. Boer, MP, Wright, D, Feng, L, Podlich, DW, Luo, L, Cooper, M, & Van Eeuwijk, F A (2007) A mixed-model quantitative trait loci (QTL) analysis for multiple-environment trial data using environmental covariables for QTL-by-environment interactions, with an example in maize. Genetics, 177, 1801-13.
94. Heslot, N, Akdemir, D, Sorrells, ME, & Jannink, JL (2014) Integrating environmental covariates and crop modeling into the genomic selection framework to predict genotype by environment interactions. Theor Appl Genet, 127, 463-80.
95. Trnka, M, Roetter, RP, Ruiz-Ramos, M, Kersebaum, KC, Olesen, JE, Zalud, Z, & Semenov, MA (2014). Adverse weather conditions for European wheat production will become more frequent with climate change. Nature Climate Change, 4, 637–643.
96. Rotter, RP, Hohn, J, Trnka, M, Fronzek, S, Carter, TR, & Kahiluoto, H (2013) Modelling shifts in agroclimate and crop cultivar response under climate change. Ecol Evol, 3, 4197-214.
97. Chenu, K, Deihimfard, R, & Chapman, SC (2013) Large-scale characterization of drought pattern: a continent-wide modelling approach applied to the Australian wheatbelt--spatial and temporal trends. The New phytologist, 198, 801-20.
98. Chapman SC, Hammer, GL, Butler, DG, & Cooper, M (2000) Genotype by environment interactions affecting grain sorghum. III. Temporal sequences and spatial patterns in the target population of environments. Australian Journal of Agricultural Research, 51, 223-234.
99. IPCC (2012) Managing the Risks of Extreme Events and Disasters to Advance Climate Change Adaptation, A Special Report of Working Groups I and II of the Intergovernmental Panel on Climate Change (eds. Field, CB, Barros, V, Stocker, TF, Qin, D, Dokken, DJ, Ebi, KJ, Mastrandrea, MD, Mach, KJ, Plattner, G-K, Allen, SK, Tignor M, & Midgley, PM).. Cambridge, UK and New York, USA: Cambridge University Press. 522pp
100. Dessai, S, & van der Sluijs, J (2011) Modelling Climate Change Impacts for Adaptation Assessments, In Simplicity, Complexity and Modelling (eds. Christie, M, Cliffe, A, Dawid, P, & Senn, S ), Chichester, UK - John Wiley & Sons Ltd, pp83-102, doi: 10.1002/9781119951445.ch6.
101. Dessai, S, Hulme, M, Lempert, R, Pielke Jr, R. (2009) Climate prediction: a limit to adaptation? , In Adapting to Climate Change: Thresholds, Values, Governance (eds. Adger, WN, Lorenzoni, I,. & O'Brien KL), Cambridge, UK - Cambridge University Press.
102. Dessai, S, Hulme, M, Lempert, R, & Pielke, R (2009). Do we need better predictions to adapt to a changing climate? Eos, Trans. Amer. Geophys. Union, 90, 111-112.
103. Wilby, R, & Dessai, S (2010). Robust adaptation to climate change. Weather, 65, 180-185.
104. Falloon, P, Challinor, A, Dessai, S, Hoang, L, Johnson, J, & Koehler, A-K (2014) Ensembles and uncertainty in climate change impacts. Front. Environ. Sci, 2, doi: 10.3389/fenvs.2014.00033
105. Dilling, L, & Lemos, MC (2011) Creating usable science: Opportunities and constraints for climate knowledge use and their implications for science policy. Glob. Environ. Change, 21, 680–689. doi:10.1016/j.gloenvcha.2010.11.006
106. Lempert, RJ, & Kalra, N (2011). Managing climate risks in developing countries with robust decision making. World Resources Report EP-201100-254. Washington, D.C.: World Resources Institute. 9pp.
107. Lempert, R, Sriver, RL, Keller, K, & Commission, CE (2012). Characterizing Uncertain Sea Level Rise Projections to Support Investment Decisions. Sacramento, CA, USA : California Energy Commission. 37pp.
108. Challinor, AJ, Thornton, P, & Smith, MS (2013). Use of agro-climate ensembles for quantifying uncertainty and informing adaptation. Agric. For. Meteorol., 170 , 2-7, doi: 10.1016/j.agrformet.2012.09.007.
109. Katz, RW, Craigmile, PF, Guttorp, P, Haran, M, Sansó, B, & Stein, ML (2013). Uncertainty analysis in climate change assessments. Nature Climate Change, 3, 769–771. doi:10.1038/nclimate1980.
110. Vermeulen, SJ, Challinor, AJ, Thornton, PK, Campbell, BM, Eriyagam, N, Vervoort, JM, Kinyangi, J, Jarvis, A, Läderach, P, Ramirez-Villegas, J, Nicklin, KJ, Hawkins, E, Smith, DR (2013). Addressing uncertainty in adaptation planning for agriculture. Proc. Nat. Acad. Sci., 110, 8357–8362, doi: 10.1073/pnas.1219441110
111. Olesen, JE, & Bindi, M (2002) Consequences of climate change for European agricultural productivity, land use and policy. Eur. J. Agron., 16, 239–262.
112. Liu, Z, Hubbard, KG, Lin, X, & Yang, X (2013) Negative effects of climate warming on maize yield are reversed by the changing of sowing date and cultivar selection in Northeast China. Glob Chang Biol, 19, 3481-92.
113. Falloon, P, Fereday, D, Stringer, N, Williams, K, & Gornall, J, et al. (2013) Assessing Skill for Impacts in Seasonal to Decadal Climate Forecasts. J Geol Geosci, 2: e111. doi:10.4172/2329-6755.1000e111.
114. Dessai, S, Soares, MB (2013) EUPORIAS (Grant agreement 308291) Deliverable 12.1, Systematic literature review on the use of seasonal to decadal climate and climate impacts predictions across European sectors, University of Leeds, Leeds, UK.
115. Hansen, JW, Mason, SJ, Sun, L, & Tall, A (2011) Review of seasonal climate forecasting for agriculture in Sub-Saharan Africa. Experimental Agriculture, 47, 205-240.
116. Macleod, D, Caminade, C, & Morse A (2012) Useful decadal climate prediction at regional scales? A look at the ENSEMBLES stream 2 decadal hindcasts. Environmental Research Letters, 7, 044012, doi:10.1088/1748-9326/7/4/044012.
117. Meinke, H, Nelson, R, Kokic, P, Stone, R, & Selvaraju, R, et al. (2006) Actionable climate knowledge - from analysis to synthesis. Climate Research, 33, 101-110.
118. Davey, M, & Brookshaw, A (2011) Long-range meteorological forecasting and links to agricultural applications. Food Policy, 36, 147-157.
119. Marshall, NA, Gordon, IJ, & Ash, AJ (2011) The reluctance of resource-users to adopt seasonal climate forecasts to enhance resilience to climate variability on the rangelands. Climatic Change, 107, 511-529.
120. Patt, A, & Gwata, C (2002) Effective seasonal climate forecast applications: examining constraints for subsistence farmers in Zimbabwe. Global Environ. Change, 12, 185–95
121. Meinke, H, Nelson, R, Kokic, P, Stone, R, & Selvaraju, R, et al. (2006) Actionable climate knowledge - from analysis to synthesis. Climate Research, 33, 101-110.
122. Valluru, R, & Van den Ende, W (2011) Myo-inositol and beyond – emerging networks under stress. Plant Science, 181, 387-400.
123. Nakashima, K, Yamaguchi-Shinozaki, K, & Shinozaki, K (2014) The transcriptional regulatory network in the drought response and its crosstalk in abiotic stress responses including drought, cold, and heat. Frontiers in Plant Science, 5, Article 170, doi: 10.3389/fpls.2014.00170
124. Cubillos, FA, Stegle, O, & Grondin C, et al. (2014) Extensive cis-regulatory variation robust to environmental perturbation in Arabidopsis. Plant Cell, 26, doi: 10.1105/tpc.114.130310
List of abbreviations
A2 – A2 emissions scenario.
AOGCM – atmosphere only general circulation model
BC – bias-corrected projections.
CCM3 – Community Climate Model version 3 (of National Centre for Atmospheric Research)
CCRA – (UK) Climate change risk assessment
CF – calibrated projections.
CIMMYT – International Maize and Wheat Improvement Center
CspB – a gene which codes for an RNA chaperone, which are commonly occurring protein molecules that bind to RNAs and facilitate their function. The gene was first identified in bacteria subjected to cold stress conditions and further research has demonstrated that cspB helps plants cope with drought stress.
Defra – Department for Environment, Food and Rural Affairs (United Kingdom)
DNA – Deoxyribonucleic acid
FAOSTAT – Food and Agriculture Organization statistics database
GM – genetically modified
GxE – Genotype by environment
HGCA – (UK) Home Grown Cereals Association
IGP – Indo-Gangetic Plains
IPCC – Intergovernmental Panel on Climate Change
IPSL - Institut Pierre-Simon Laplace
MAS – marker-assisted selection
MET – multi-environment trials
MLN – Maize lethal necrosis
NaCl – sodium chloride
NIAB – National Institute of Agricultural Botany
NIC – National Information Center (USA)
NL – national list (trials)
QTL – quantitative trait loci
QUMP – Quantifying uncertainty in model predictions
RL – recommended list (trials)
RLFP – Restriction fragment length polymorphism
RNA – Ribonucleic acid
RNAi – Ribonucleic acid interference
SRES – IPCC special report on emissions scenarios
STB – Septoria tritici blotch
TPE – target population of environments
UKCP09 – 2009 United Kingdom Climate Projections
UN – United Nations
Glossary of terms
Acari – a taxon of arachnids that contains mites and ticks.
Alleles – one of a number of alternative forms of the same gene or same genetic locus. Sometimes, different alleles can result in different observable phenotypic traits, such as different pigmentation.
Arabidopsis. – (rockcress) is a genus in the family Brassicaceae. They are small flowering plants related to cabbage and mustard. This genus is of great interest since it contains thale cress (Arabidopsis thaliana), one of the model organisms used for studying plant biology and the first plant to have its entire genome sequenced. Changes in thale cress are easily observed, making it a very useful model.
Backcrossing – Backcrossing is a crossing of a hybrid with one of its parents, or an individual, genetically similar to its parent, in order to achieve offspring with a genetic identity which is closer to that of the parent.
Bacteria – a large domain of prokaryotic (single celled) microorganisms.
Bioclimatic mathematical model – a model for predicting suitable plant habitat to biological and climatic factors.
Bottom up – In the bottom-up approach, climate adaptation is framed as a social and institutional process that involves many actors and many decisions at different levels. Outcomes of actions can usually not be predicted because they depend on actions and interactions of many actor groups as well as the social and cultural context.
Chaperone – In molecular biology, molecular chaperones are proteins that assist the covalent folding or unfolding and the assembly or disassembly of other macromolecular structures.
Climate adaptation – a response to climate change that seeks to reduce the vulnerability of social and biological systems to current climate change and thus offset its effects.
Climate model – Climate models use quantitative methods to simulate the interactions of the atmosphere, oceans, land surface, and ice. They are used for a variety of purposes from study of the dynamics of the climate system to projections of future climate.
Coleoptera – biological classification for the beetle group of insects.
Confidence interval – in statistics, this gives an estimated range of values which is likely to include an unknown population parameter, the estimated range being calculated from a given set of sample data.
Crop model – a simulation model that helps estimate crop yield as a function of weather conditions, soil conditions, and choice of crop management practices.
Crop phenology – the study of periodic crop plant life cycle events (such as emergence of leaves and flowers) and how these are influenced by seasonal and interannual variations in climate, as well as habitat factors (such as elevation).
Decadal forecast – Ten year climate forecasts, also called 'near-term' climate predictions, range up to a decade ahead. Predictions account for natural variability and climate change as these are expected to be of similar size in many parts of the world over this forecast period. Forecasts are experimental, so at this early stage of development expert advice is needed to assess the reliability of regional predictions.
Developmental stage – crop development defined using the 10 stages of Zadok’s scale, from germination to ripening.
Diptera – the biological order of two-functional winged insects including flies.
DNA sequence motifs – Sequence motifs are short, recurring patterns in DNA that are presumed to have a biological function.
DNA sequencing – the process of determining the precise order of nucleotides (organic molecules that serve as the monomers, or subunits, of nucleic acids like DNA and RNA) within a DNA molecule.
Doubled haploid – a doubled haploid plant has cells containing 2 gene sets which are exactly identical.
Drought metric – a metric used to describe the severity of drought, usually calculated from weather variables such as precipitation, although a variety of drought metrics exist including meteorological, hydrological and agricultural.
Drought stress patterns – water limitations to the crop during different developmental stages and of different severity, using a simulated water stress index and grouping simulations into categories (e.g. later water stress, early water stress, no water stress)
Edaphic factors – factors related to soil, such as drainage, texture, or chemical properties such as pH, and their relationships with plant communities.
Ensemble – In physics, a statistical ensemble is a large set of copies of a system, considered all at once; each copy of the system representing a different possible detailed realisation of the system, consistent with the system’s observed macroscopic properties. A climate ensemble involves slightly different models of the climate system.
Forecast skill – a scaled representation of forecast error that relates the forecast accuracy of a particular forecast model to some reference model. For example, a perfect forecast results in a forecast skill of 1.0, a forecast with similar skill to the reference forecast would have a skill of 0.0, and a forecast which is less skillful than the reference forecast would have negative skill values.
Fungi – any member of a large group of eukaryotic organisms that includes microorganisms such as yeasts and molds, as well as the more familiar mushrooms.
Future scenario – Because it is difficult to project far-off future emissions and other human factors that influence climate, scientists use a range of scenarios using various assumptions about future economic, social, technological, and environmental conditions.
GCM – general circulation model
Genes – A gene is the basic physical and functional unit of heredity. Genes, which are made up of DNA, act as instructions to make molecules called proteins.
Genetic architecture – Genetic architecture refers to the underlying genetic basis of a phenotypic trait (itself the composite of an organism's observable characteristics or traits, such as its morphology, development, biochemical or physiological properties, phenology, behaviour, and products of behaviour).
Genetic correlation – Genetic correlation is the proportion of variance that two traits share due to genetic causes.
Genome – an organism's complete set of DNA, including all of its genes. Each genome contains all of the information needed to build and maintain that organism.
Genome-wide Associative analysis – In genetic epidemiology, a genome-wide association study (GWA study, or GWAS), also known as whole genome association study (WGA study, or WGAS) or common-variant association study (CVAS), is an examination of many common genetic variants in different individuals to see if any variant is associated with a trait.
Genotype – the genetic makeup of a cell, an organism, or an individual usually with reference to a specific characteristic under consideration.
GGCM – global gridded crop model
Goss’s wilt – a disease of maize which is caused by a bacterial pathogen that overwinters in residue of corn and several grasses.
Hemiptera – Hemiptera is an order of insects most often known as the true bugs, comprising around 50,000–80,000 species of cicadas, aphids, planthoppers, leafhoppers, shield bugs, and others.
High resolution climate models – climate model with a high spatial resolution (grid box size). High resolution is often necessary to realistically capture climate extremes, particularly for precipitation.
Hymenoptera – one of the largest orders of insects, comprising the sawflies, wasps, bees and ants. Over 150,000 species are recognized, with many more remaining to be described.
Introgressed – Introgression, also known as introgressive hybridization, in genetics (particularly plant genetics) is the movement of a gene (gene flow) from one species into the gene pool of another by the repeated backcrossing of an interspecific hybrid with one of its parent species.
Isoptera – or termites are small to medium sized insects ranging form 3-20 millimetres in body length.
Lepidoptera – a large order of insects that includes moths and butterflies
Loci – In genetics, a locus (plural loci) is the specific location of a gene, DNA sequence, or position on a chromosome.
Marker map – A genetic marker is a gene or DNA sequence with a known location on a chromosome that can be used to identify individuals or species. Mapping is putting markers in order, indicating the relative genetic distances between them, and assigning them to their linkage groups on the basis of the recombination values from all their pairwise combinations.
Median – In statistics and probability theory, the median is the numerical value separating the higher half of a data sample, a population, or a probability distribution, from the lower half
Microsatellites – also known as simple sequence repeats (SSRs) or short tandem repeats (STRs), are repeating sequences of 2-5 base pairs of DNA.
Nematoda – see nematode
Nematode – The nematodes or roundworms constitute the phylum Nematoda. They are a diverse animal phylum inhabiting a very broad range of environments. While most of the thousands of species of nematodes on Earth are not harmful, some nematodes parasitize and cause diseases in humans and other animals.
Oomyceta – see oomycetes
Oomycetes – The Oomycota include the so-called water molds and downy mildews, and absorb their food from the surrounding water or soil, or may invade the body of another organism to feed. As such, oomycetes play an important role in the decomposition and recycling of decaying matter. Other parasitic species have caused much human suffering through destruction of crops and fish.
Pathogen – a biological agent that causes disease or illness to its host.
Precipitation – any form of water – liquid or solid – falling from the sky. It includes rain, sleet, snow, hail and drizzle plus a few less common occurrences such as ice pellets, diamond dust and freezing rain.
Probabilistic projection – projections of future climate that assign a probability level to different climate outcomes.
Product profile – derived from the needs of growers, distributors and consumers of crops, The product profile serves as a guideline for product development and is the basis for variety profiles.
Projection – The term “projection” is used in two senses in the climate change literature. In general usage, a projection can be regarded as any description of the future and the pathway leading to it. However, a more specific interpretation has been attached to the term “climate projection” by the IPCC when referring to model-derived estimates of future climate.
Protozoa – single cell organisms.
Quantiles – values which divide a statistical frequency distribution such that there is a given proportion of observations below the quantile.
Regression – In statistics, regression analysis is a statistical process for estimating the relationships among variables.
Seasonal forecast – Weather forecasts provide information about the weather expected over the next few days. While it is generally not possible to predict these day-to-day changes in detail beyond about a week ahead, it is possible to say something about likely conditions averaged over the next few months. Seasonal forecasts provide information about these long-term averages.
Single nucleotide polymorphism – or SNP, is a variation at a single position in a DNA sequence among individuals.
Soil salinisation – the accumulation of soluble salts of sodium, magnesium and calcium in soil to the extent that soil fertility is severely reduced.
Stewart’s wilt – a serious bacterial disease of corn caused by the bacterium Pantoea stewartii. This bacterium affects plants, particularly types of maize or corn such as sweet, flint, dent, flower and popcorn.
Stress covariate – In statistics, a covariate is a variable that is possibly predictive of the outcome under study. A covariate may be of direct interest or it may be a confounding or interacting variable. For example, for crop heat stress, different weather variables could be stress covariates.
Surface temperature – the Earth’s average above-ground and sea surface temperature.
Taxonomic group – animal or plant group having natural relations
Thermal time requirements – time and temperature requirements for various crop development processes to occur, such as germination, emergence and seedling development
Thysanoptera – or Thrips, are tiny, slender insects with fringed wings. Other common names for thrips include thunderflies, thunderbugs, storm flies, thunderblights, storm bugs, corn flies and corn lice.
Top down – In the top-down framing, climate adaptation relates to decisions that are taken on the basis of simulated global climate scenarios downscaled to a regional level and fed into impact models to estimate potential impacts. Based on this, adaptation measures are then identified and evaluated via multi-criteria, cost-effectiveness or cost-benefit analysis
Transcription factor – In molecular biology and genetics, a transcription factor (sometimes called a sequence-specific DNA-binding factor) is a protein that binds to specific DNA sequences, thereby controlling the rate of transcription of genetic information from DNA to messenger RNA.
Transgenic event - refers to the unique DNA recombination event that took place in one plant cell, which was then used to generate entire transgenic plants.
Uncertainty range - Defines an interval within which a numerical result is expected to lie within a specified level of confidence.
Viroids - Viroids are the smallest infectious pathogens known, consisting solely of short strands of circular, single-stranded RNA without protein coats.
Download pdfFigures
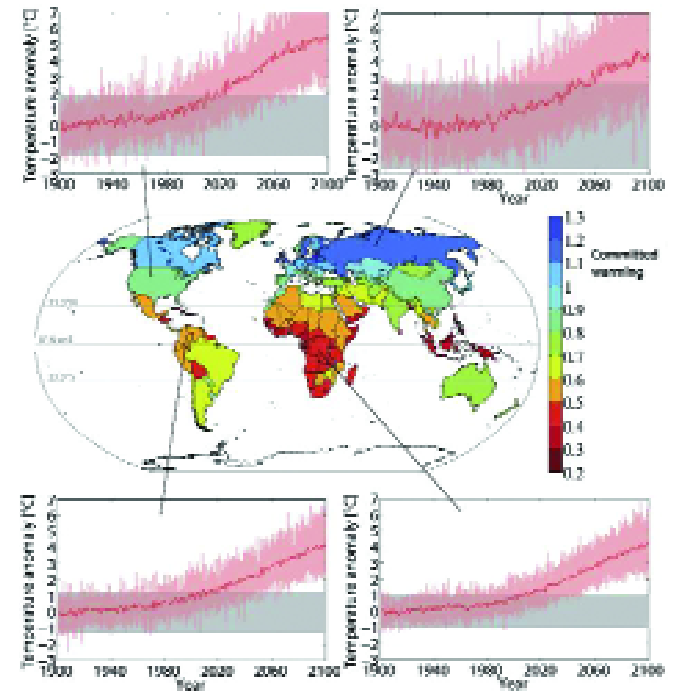
Fig. 1, from (4). The map shows the global temperature increase (°C) needed for a single location to undergo a statistically significant change in average summer seasonal surface temperature, aggregated on a country level. As noted in the text, the figure illustrates that due to the relatively small inter-annual temperature variability in the tropics, low latitude countries are projected to experience measureable change in climate earlier than temperate regions. For many tropical countries, local warming outside past variability is either emerging at present, or could emerge in the next few decades. The black horizontal line adjacent to the colour bar denotes the committed global average warming if all atmospheric constituents were fixed at year 2000 levels (the warming implied by previous human activity, even if further greenhouse gas emissions were halted). The small panels show the inter-annual summer-season variability during the base period (1900–29) (± 2 standard deviations shaded in grey) and the multi-model mean summer surface temperature (bold red curve) of one arbitrarily chosen grid cell within the specific country. The shading in red indicates the 5% and 95% quantiles across all model realizations. Reproduced with permission from IOP Science, Copyright © 2011 IOP Science.
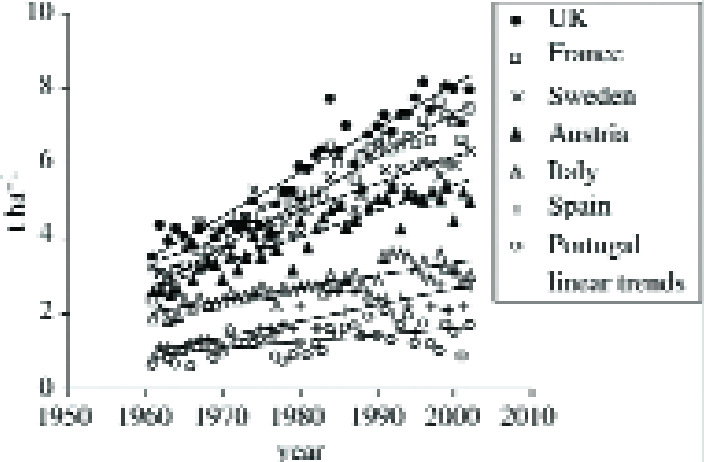
Fig. 2, from (9) – Observed (FAO 2003) increases in grain yields of wheat for selected countries in Europe. The greater rise in historic yields in Northern Europe, compared to Southern Europe indicates that temperature and rainfall may have more strongly influenced yields in Northern Europe, and warming may already be affecting European yields. Copyright © 2005, The Royal Society, and reproduced under license.
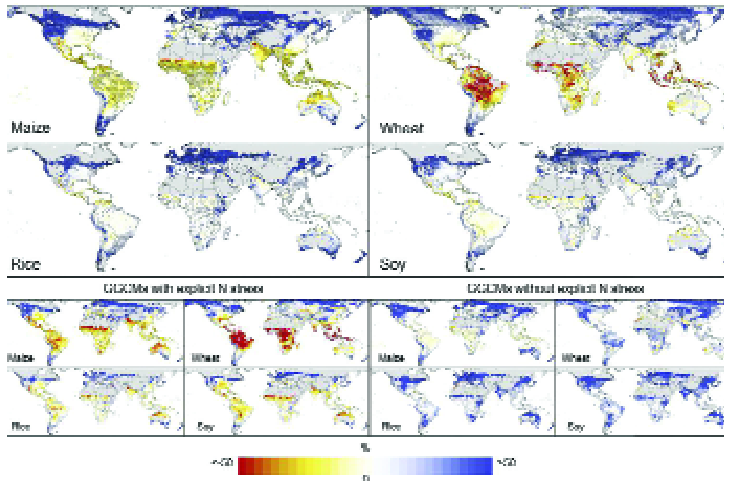
Fig. 3, from (13): Median yield changes (%) for a “business-as-usual” climate scenario (RCP8.5) (2070–2099 in comparison to 1980–2010 baseline), including CO2 effects on crops, over all five General Circulation Models (GCMs) x seven Global Gridded Crop Models (GGCMs) (6 GGCMs for rice) for rainfed maize (35 ensemble members), wheat (35 ensemble members), rice (30 ensemble members), and soy (35 ensemble members). Hatching (stippling) indicates areas where more than 70% of the ensemble members agree on the directionality of the impact factor. Grey areas indicate historical areas with little to no yield capacity. The bottom 8 panels show the corresponding yield change patterns over all five GCMs x four GGCMs with nitrogen stress (20 ensemble members from the crop models EPIC, GEPIC, pDSSAT, and PEGASUS; except for rice which has 15) (Left); and 3 GGCMs without nitrogen stress (15 ensemble members from the crop models GAEZ-IMAGE, LPJ-GUESS, and LPJmL). Reproduced from (13) doi:10.1073/pnas.1222463110; with permission from the National Academy of Sciences.
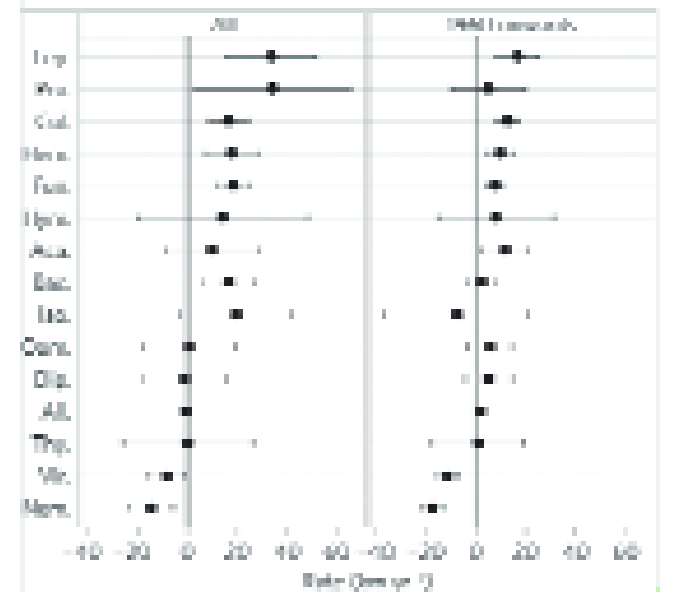
Fig. 4, from (38); Mean latitudinal shift (km yr-1) for pest taxonomic groups in the Northern Hemisphere for all years (1942-2011), and for 1960 onwards. Estimates are from linear mixed-effects models of latitude against observation year for centred species-level data. Positive values denote a poleward shift, negative values a shift towards the Equator. Error bars show 95% confidence intervals of the mean. Taxonomic groups are abbreviated, and combined observations (All) included for comparison. Groups are ordered by the mean of the coefficients. Lep. – Lepidoptera; Pro. – Protozoa; Col. – Coleoptera; Hem. – Hemiptera; Fun. – Fungi; Hym. - Hymenoptera; Aca. – Acari; Bac. – Bacteria; Iso. – Isoptera; Oom. – Oomyceta; Dip. – Diptera; All. – All groups combined; Thy. – Thysanoptera; Vir. – Viruses; Nem. - Nematoda (for definitions, see glossary).
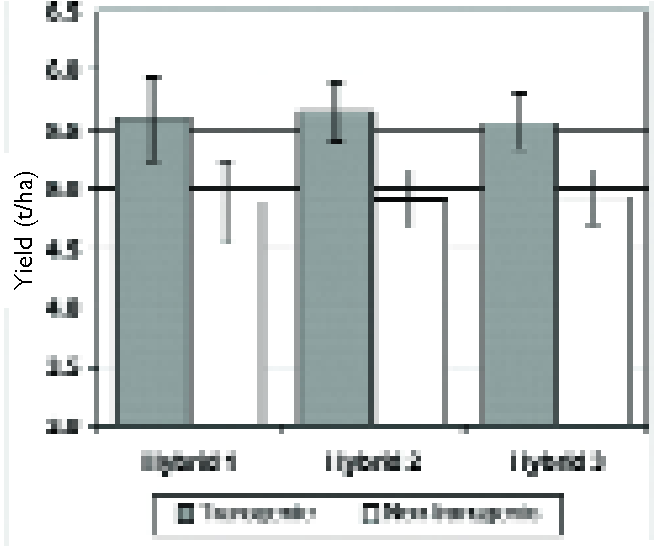
Fig. 5, from (66): Yield results from Midwest evaluations under water-deficit conditions. Three different corn hybrids carrying a single transgenic event expressing CspB were evaluated in yield trials across the western dryland market. CspB is a gene which codes for an RNA chaperone, which is a set of commonly occurring protein molecules that bind to RNAs and facilitate their function. The gene was first identified in bacteria subjected to cold stress conditions and further research has demonstrated that CspB helps plants cope with drought stress. Yield results were averaged across locations that experienced water-deficit stress during the late vegetative or grain fill periods of the season. Republished with permission of American Society of Plant Biologists, from Castiglioni et al. (2008) (66); permission conveyed through Copyright Clearance Center, Inc.
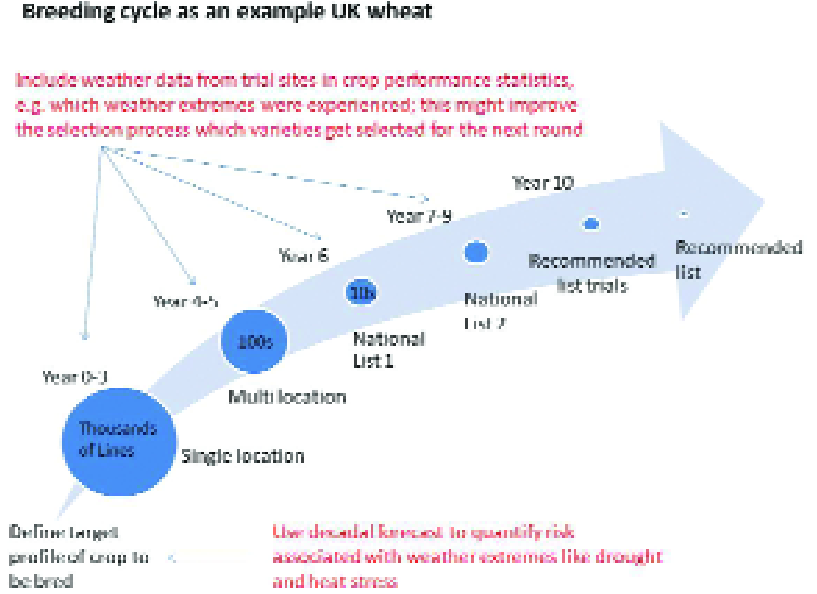
Fig. 6: A typical crop breeding cycle, based on UK winter wheat.
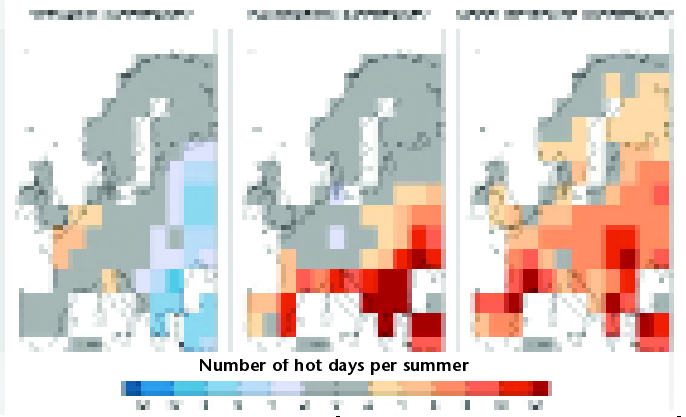
Fig. 7, from (88). Uncertainties in the number of summer days in 2030–2059 ith maximum temperature > 30 °C, derived from different sources. (Left) Uncertainty de to future scenarios = difference between the raw output of the Institut Pierre Simon Laplace IPSL) Atmosphere-Ocean General Circulation Model (AOGCM) climate model from to different future emissions scenarios (Special Report on Emissions Scenarios (SRES) A1B (assuming a globalised world with rapid economic growth, and a balanced emphasis on all energy sources) and A2 (assuming a world with regionally oriented economic development). (Middle) Uncertainty due to model calibration and errors = difference between the mean bias-corrected (BC) and calibrated (CF) projections using the Quantifying Uncertainties in Model Predictions (QUMP) ensemble to predict the IPSL AOGCM data. (Right) Uncertainty due to climate model responses = 2 x the standard deviation in the BC calibrated QUMP ensemble, predicting the IPSL AOGCM data. Reprinted from Agricultural and Forest Meteorology, 170, Hawkins E., Osborne T.M., Ho, C.K., and Challinor A.J., Calibration and bias correction of climate projections for crop modelling: An idealised case study over Europe, 19-31, Copyright (2013), with permission from Elsevier.
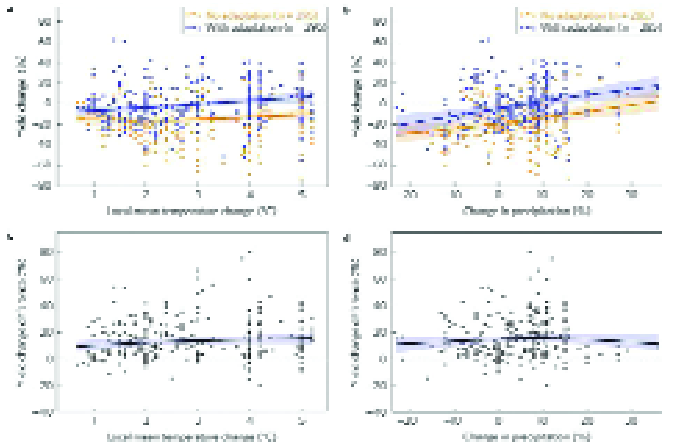
Fig. 8, from (15): Quantification of the benefits of adaptation. Percentage yield change as a function of temperature (a) and precipitation (b), for the 33 paired adaptation studies, across all regions and crops (wheat, rice and maize). Shaded bands indicate the 95% confidence interval of regressions consistent with the data based on 500 bootstrap* samples, with blue and orange bands corresponding to with and without adaptation. c,d, The difference between simulations with and without adaptation for temperature (c) and precipitation (d) are shown, using the same bootstrapping technique. Note that part of the lack of decline at high temperatures in the non-adaptation curve in (a) is due to high representation of rice (23 of 28 no-adaptation studies with T >4°C and yield change >0), which shows less sensitivity to high local temperature change than other crops. The dataset used is considered reasonably representative of the major global producers, although Brazilian maize and rice in Indonesia and Bangladesh are under-represented. Reprinted by permission from Macmillan Publishers Ltd: Nature Climate Change (doi:10.1038/nclimate2153), copyright (2014).
*Bootstrapping is any statistical test or metric that relies on random sampling with replacement, allowing measures of accuracy and precision (e.g. bias, variance, confidence intervals, prediction error) to be assigned to sample estimates.
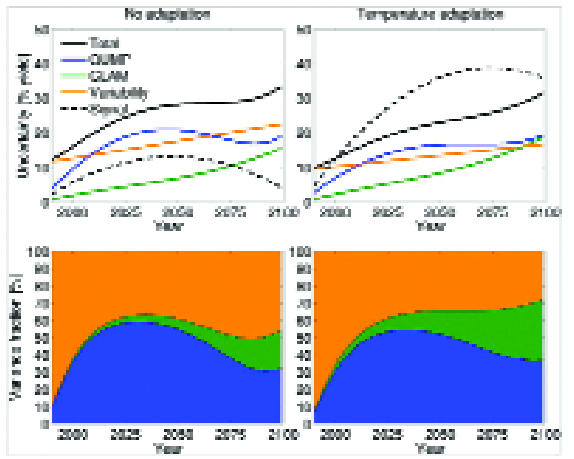
Figure 9 (from 109): Uncertainty* in decadal mean wheat yield in China, from different sources (Upper): climate model ensemble (Quantifying Uncertainty in Model Predictions (QUMP), blue), crop model ensemble (General Large-area Model for Annual crops (GLAM), green), and natural variability in decadal mean yield (orange). The total uncertainty (solid black) and actual change in decadal mean yield normalized** to the baseline (signal, dashed black) are also shown. The signal (or rate of change) in decadal crop yields is detectable when it exceeds the total uncertainty. (Lower) Fraction of total variance*** explained by the three separate components of uncertainty. These metrics are shown assuming no adaptation (Left) and temperature adaptation. Reproduced from Vermeulen, SJ, Challinor, AJ, Thornton, PK, Campbell, BM, Eriyagama, N, Vervoort, JM, Kinyangi, J, Jarvis, A, Läderach, P, Ramirez-Villegas, J, Nicklin, KJ, Hawkins, E and Smith, DR (2013) Addressing uncertainty in adaptation planning for agriculture. Proceedings of the National Academy of Sciences of USA, 110 (21). 8357 – 8362; with permission from the National Academy of Sciences.
*Uncertainty here is presented as percentage of the actual change in yield
**Change in yield expressed as % change relative to the baseline (present-day) value
***Expressed as a percentage of the total variance (or uncertainty) in yield change.