
The functions and sizes of the five carbon sinks on planet Earth and their relation to climate change Part I Their present sizes and locations

Introduction
The carbon cycle is the biogeochemical cycle by which carbon is exchanged among five spheres of the Earth, carbon (C) sinks: the biosphere, pedosphere, lithosphere, hydrosphere, and atmosphere (These are not mutually exclusive, see Glossary).
Along with the nitrogen cycle and the water cycle, the carbon cycle comprises a sequence of events that is key to making the Earth capable of sustaining life; it describes the movement of carbon as it is recycled and reused throughout the biosphere.
The lifetime of carbon in sediments is measured in hundreds of millions of years.
Carbon is returned from sediments to the ocean/atmosphere/biosphere/soil when sediments are uplifted and weathered or when the sediments are drawn down into the mantle and cooked.
Return in the latter case occurs in conjunction with hot springs and volcanoes. Changes in sediment cycling rates over time have resulted in a variety of different levels of carbon in the atmosphere and for a wide range of different climate conditions. The lifetime of carbon in the ocean/atmosphere/biosphere/soil reservoir is a few hundred thousand years.
We would expect variations in CO2 occasioned by temporary imbalances in the sediment source/sink to be manifest therefore on time scales at least this long. The challenge at the moment is that demands for the fossil fuels (coal, oil and natural gas) and cement production in our modern economy are seriously accelerating the natural rate at which carbon is returned to the atmosphere from sediments, by more than a factor of 50 (1).
n.b. Cement = calcium carbonate + clay +heat > Ca3SiO5 + Ca2Al2O5 + quick lime + silica
i.e. CaCO3 + heat > CaO (quick lime) + CO2
A portion of the CO2 added to the atmosphere over the past several hundred years has been absorbed by the ocean.
At the same time there have been important changes in the quantity of carbon stored in the biosphere and soils.
The early rise in CO2 was clearly due to a net release of carbon from the biosphere, including soils.
Conversion of forested land to agriculture in the eastern region of North America in the late 18th and early 19th centuries, for example, resulted without question in a net transfer of carbon to the atmosphere: the observed increase in the abundance of atmospheric CO2 in this period exceeds by a significant factor the quantity of CO2 produced as a consequence of the early use of fossil fuels.
As richer soils in the interior of the continent were opened up for development, poorer lands in the East were abandoned and forests were allowed to regrow. Ploughing the carbon rich soils of the Mid West resulted almost certainly in an additional net transfer of carbon to the atmosphere. Regrowth of the forests previously depleted in the East would have resulted in a net sink for atmospheric carbon.
Closer to present, it is apparent that clearance of land in the tropics and subtropics, deforestation, has contributed an important additional source of atmospheric CO2. On the other hand, the biosphere/soil system on a global scale is presently a net sink (1).
Agriculture and agroforestry are part of the biosphere and both affect its C flux and are influenced by that flux.
The paper by Chavan et al. (in this Issue) describes the various roles agro-forestry can play. These include carbon sequestration. This is accomplished by converting CO2 into organic carbon, temporarily taking it out of the carbon cycle, and so reducing atmospheric CO2 concentration.
Exchange of C between the atmosphere and the biosphere depends on fixing the gaseous C in photosynthesis:
6CO2 + 6H2O ------> C6H12O6 + 6O2
+ sunlight.
A question which is posed by this- does it make a worthwhile contribution to carbon flux /and to reducing greenhouse gas (GHG) production and what is the comparative scale of other influences?
The largest and most direct human influence on the carbon cycle is through direct emissions from burning fossil fuels, which transfers carbon from the geosphere into the atmosphere.
There are two aspects we need to determine: (1) the size of each C sink, and (2) the rate of emissions from (as a source) and uptakes (as a sink) of C by each sphere. In 2010, 9.14 x 10⁹ tonnes C (33.5 x 10⁹ tonnes of CO2) were released from fossil fuels and cement production worldwide, compared to 6.15 x 10⁹ tonnes C in 1990 (2).
What proportion remained in the atmosphere and what are the prospects of reducing, or containing, the increase in atmospheric GHG?
We are dividing this discussion into two parts. In Part I we shall describe the size and changing size of the C sinks and the influence of the various atmospheric GHGs.
In Part II to be published next month we shall examine evidence for the rates of movement of carbon between sinks and discuss the future role agroforestry and agriculture should play in this.
Sizes of Carbon sinks
Carbonate rocks (limestone and chalk) are the major sources of C in the lithosphere, the quantity of which is by far the greatest reservoir of C on this planet.
The oceanic sink is the second largest, owing mainly to its vast volume and the presence inorganic carbonates.
The estimates are given in Table 1.
Composition of the Atmospheric Sink
Greenhouse Gases (GHGs)
The major atmospheric constituents, nitrogen (N2), Earth’s atmosphere (O2), and argon (Ar), are not GHGs.
This is because molecules containing two atoms of the same element such as N2 and O2 and monatomic molecules such as argon (Ar) have no net change in the distribution of their electrical charges when they vibrate and hence are almost totally unaffected by infrared radiation.
Nevertheless, although ozone has three atoms of the same element there is a change in the distribution of electrical charges when their vibration is increased, making it a GHG.
The primary greenhouse gases (Table 2) in the are water vapour, carbon dioxide, methane, nitrous oxide, and ozone.
Without these gases, the average temperature of Earth’s surface would be about −18 °C (0 °F).
The contribution each molecular species makes to the warming of the Earth, depends on two characteristics of each species: (1) the innate response of that molecule to infrared radiation and (2) the atmospheric concentration and half-life of that molecular species. Hence, the ranges quoted in Table 2 and the consequential dependence on the time interval under consideration after joining the atmosphere (Table 3).
CO2 persists in the atmosphere much longer than does methane and so it is at a greater concentration and is therefore the most important GHG (5).
Water vapour cycles rapidly and its concentration cannot be controlled, although, undoubtedly, it will become of increasing importance, owing to its likely increase as the oceans warm up.
The atmospheric concentration of GHGs is greater than it has been for hundreds of thousands of years (see Figure 1 for values up to 2007).
At the present day, 2016, the mean atmospheric concentration of CO2 is over 400 ppm.
Uptake (release) of carbon by the biosphere is estimated to be responsible for a source (sink) of 1.1 mole of O2 for every mole of CO2 involved in the atmosphere/biosphere exchange process.
The larger value in the ratio for O2 relative to that of CO2 is associated with fossil fuel combustion, as compared to biospheric exchange, the ratio reflects the influence of hydrogen rich components in the fuel mix. (Combustion of CH4 in natural gas is responsible for consumption of 2 moles of O2 with the production of each mole of CO2).
Ocean
The oceanic sink is the second largest sink (Table 1), holding approximately 38,400 x 109 tons of C, much of which is in the form of calcium and magnesium carbonates, which give the oceans a buffering capacity for CO2.
Uptake of CO2 by the ocean is determined by the difference between the partial pressures of CO2 in the air and in surface waters of the ocean.
The abundance of CO2 in the ocean is regulated by an equilibrium among the three primary forms of inorganic carbon dissolved in sea water, HCO3- , CO32- and CO2.
Net uptake of CO2 by the ocean and land biosphere between 1995 and mid 2007 amounted to 25.7 (2.14 yr-1) and 13.1 (1.09 yr-1) C t x109, respectively.
Over the same period, fossil fuels added 89.3 (7.44 yr-1) C t x109 to the atmosphere and the abundance in the atmosphere increased by 50.5 C t x109 (i.e. 89.3 –[25.7 +13.1]). Defining the airborne fraction as the fraction of net carbon added to the atmosphere that persists in the atmosphere, these results imply an airborne fraction of 56.5% (i.e. 100 x 50.5/89.3) (1).
Current trends in climate change lead to higher ocean temperatures, thus modifying ecosystems and very gradually reducing the ocean’s capacity to hold CO2. Additional release of CO2 from the ocean to the atmosphere could arise as a result of net warming of surface ocean waters.
However, the role of oceanic cyanobacteria and algae to convert the more readily available CO2 by photosynthesis to carbohydrate seems to have been ignored by many investigators.
Acid rain and polluted runoff from agriculture and industry change the ocean’s chemical composition. Such changes can have dramatic effects on highly sensitive ecosystems such as coral reefs, reducing oceanic biodiversity. It is the decrease in [CO32-] which leads to the decrease in Aragonite and Calcite saturation, as the pH is still buffered to above 7. This is the problem for organisms that use these minerals for calcification (e.g. corals, pteropods, molluscs, & foramina).
Terrestrial Biosphere
Soil
This is the sphere of direct concern to agriculture. Land is estimated to hold of the order of 2000 x 109 tonnes C worldwide (Table 1) of which world forest trees contain about 58%.
Amazonian forests contain about 4% (47 x 109 tonnes C). Deforestation for agricultural purposes leads to land cover which stores comparatively small amounts of carbon, so that the net product of the process is that more carbon stays in the atmosphere.
However, the contemporary increase in the concentration of CO2 in the atmosphere owes mainly to emissions associated with combustion of fossil fuels.
Since 1995, approximately 57% of the carbon released as a result of the fossil fuel source has persisted in the atmosphere and 15% has been absorbed by the land biosphere.
It is clearly important to define the nature of this biospheric sink and indeed its location. Evidence suggests that it is concentrated primarily at mid-latitudes of the Northern Hemisphere.
Possible explanations include a climate induced extension of the growing season, enhanced uptake by photosynthesis prompted by the increasing level of CO2 in the atmosphere, and, potentially, regrowth of vegetation representing return to conditions prevalent prior to the mid 20th century when the biosphere is estimated to have provided a net source rather than a net sink for CO2.
The subsequent regrowth of forests depleted previously in conjunction with conversion of land for purposes of agriculture is likely to be a contributory factor.
Compounding the challenge is:
(1) the likelihood that soils at high latitude may be responsible for a net source of CO2 (see “Peat”, below) and
(2) that there will be additional release associated with deforestation in the tropics (in countries such as Brazil and Indonesia), the latter representing a repeat of what happened earlier in the mid-latitude regime.
Natural forests are important as a source of environmental services. The fact is that eliminating these systems to feed the world, converting them either to pasture or annual crops can provide a more immediate return to those who own or control the land.
Current economic accounting fails regrettably to recognize the intrinsic value of the environmental services provided by these natural ecosystems. If we are to avoid unacceptable future disruption to the global climate system, it will be necessary to constrain future growth in the concentration of the key greenhouse gases, not only CO2 but also CH4 and N2O.
Reduction in emissions of CO2 from fossil fuels can make an important contribution to this objective. The role of environmental services provided by these natural ecosystems should be preserved in regulating the concentrations of the key atmospheric GHGs, and the contribution made to maintaining an accommodating hydrological cycle (1)
Soil Respiration and Carbon Sequestration
The estimated annual flux of CO2 from soils to the atmosphere in 1995 was estimated to be 21C t x 109yr−1, greater than previous global estimates, and 30–60% greater than terrestrial net primary productivity (6).
Between 1989 and 2008 soil respiration increased by about 0.1% per year (7) (0.1 CO2 t x 109yr−1). In 2008, the global total of CO2 released from the soil reached roughly 98 billion tonnes, (27 C t x 109yr−1) (1), about three times more carbon than humans are now putting into the atmosphere each year by burning fossil fuel and cement manufacture (1) (i.e., 9-10 C t x 109 yr-1).
There are a few plausible explanations for this trend, but the most likely explanation is that increasing temperatures have increased rates of decomposition of soil organic matter, which has increased the flow of CO2. (compare these values with RS, soil respiration rate, below).
The extent of carbon sequestering in soil is dependent on local climatic conditions and thus changes in the course of climate change.
From the pre-industrial era to 2010, the terrestrial biosphere represented a net source of atmospheric CO2 prior to 1940, switching subsequently to a net sink (1). As well as enhancing food security, in future carbon sequestration has the potential to offset fossil fuel emissions by 0.4 to 1.2 gigatons of carbon per year, or 5 to 15% of the global fossil-fuel emissions (8).
Soil CO2 fluxes have a pronounced seasonal pattern in most locations, with maximum emissions coinciding with periods of active plant growth.
Models indicate that soils produce CO2 throughout the year and thereby contribute to the observed wintertime increases in atmospheric CO2 concentrations (Fig. 3).
The derivation of statistically based estimates of soil CO2 emissions at a 0.5° latitude by longitude represents the best-resolved estimate to date of global CO2 fluxes from soils and should facilitate investigations of net carbon exchanges between the atmosphere and terrestrial biosphere (10).
Soil respiration, RS, the flux of microbially and plant-respired carbon dioxide (CO2) from the soil surface to the atmosphere, is the second-largest terrestrial carbon flux (7). However, the dynamics of RS are not well understood and the global flux remains poorly constrained.
Ecosystem warming experiments indicate that RS should change with climate. After adjusting the data for mean annual climate, leaf area, nitrogen deposition and changes in
CO2 measurement technique the observations indicate that the air temperature anomaly (the deviation from the 1961–1990 mean) is significantly and positively correlated with changes in RS (7).
The conclusion is that the flux, integrated over the Earth’s land surface, was increasing at the rate of 0.1 Pg C yr-1 between 1989 and 2008. It has been estimated (7) that the global RS in 2008 (that is, the flux integrated over the Earth’s land surface over 2008) was 98 ± 12 t C x 109 and that it increased by 0.1 Pg C yr-1 between 1989 and 2008.
This value is ten times the value for the annual loss of C to the atmosphere derived from fossil fuels and cement manufacture.
An increasing global RS value does not necessarily constitute a positive feedback to the atmosphere, as it could be driven by higher carbon inputs to soil rather than by mobilization of stored older carbon. The available data are, however, consistent with an acceleration of the terrestrial carbon cycle in response to global climate change (11).
Peat
Oxides of Nitrogen:
Although our concerns in this review are principally with the C cycle, fuller understanding of the causes of global warming requires reference to oxides of N. There is insufficient data on the natural rate at which there is inter-conversion amongst the NOx; Nevertheless, there is ample evidence on their differential effects.
Nitric oxide, NO, is an essential metabolite for normal human well-being. Individuals unable to synthesise NO from L-arginine in the lining of arteries under the influence of the enzyme arginase, suffer severe hypertension, as the central regulation of blood pressure, smooth muscle relaxation, and vasodilatation are interrupted.
There is a very slow rate of oxidation of NO to NO2, nitrogen dioxide. Under natural conditions NO2 reacts with water causing acid rain (nitric acid, HNO3) and as a consequence is said to be associated with emphysema and bronchitis. NO2, is a gas in the exhaust fumes of road vehicles which is the cause of the EU’s concern for human safety.
All gases are toxic and lethal to humans when inhaled continuously at abnormal concentrations.
There is some evidence which shows exposure to 1.5 ppm nitrogen dioxide (NO2) for 3 h increases airway reactivity (12), although other evidence has described no ill effect.
Nitrous oxide (N2O) is an extremely potent GHG (Table 3). Use of excessive rates of N fertilizers causes a local rise in atmospheric N2O concentrations.
Drainage of peat soils results in CO2 and N2O emissions of globally 2-3 t CO2 e x 109an-1 (approximately 0.7 t Ce x 109an.-1) (13). These high emission rates can be avoided by peatland rewetting and restoration(14). Rewetting of peatlands suppresses aerobic CO2 and N2O emissions but leads to increased methane (CH4) emissions (see below).
Methanogenesis:
Over thousands of years peatlands have developed deposits of 1.5 to 2.3 m- the average depth of the boreal peatlands.
One of the most common components is Sphagnum moss, although many other plants can contribute. Soils that contain mostly peat are known as histosols.
Peat forms in wetland conditions, where flooding obstructs flows of oxygen from the atmosphere, slowing rates of decomposition leading to methane fluxes.
Yet methane fluxes are negligible in SE Asian peatlands at low water levels and only amount hourly to up to 3 mg CH4 m−2 h−1 at high water levels.
This is low compared with emissions from boreal and temperate peatlands (13,15). The scientific data base for methane (CH4) emissions from peatland is much larger than that for CO2 or N2O. In an anaerobic environment the availability of fresh plant material is the major factor in methane production. Old (recalcitrant) peat plays only a subordinate role.
The global CO2 emissions from drained peatlands have increased from 0.288 C t x 109 to 0.354 C t x 109, from 1995 to 2008 (>20%), excluding effects of N2O (16). This increase has particularly taken place in developing countries, of which Indonesia, China, Malaysia, and Papua New Guinea, are the fastest growing top emitters. This estimate excludes emissions from peat fires (conservative estimates for the effect of fires amount to at least 1.1 C t x 109 an-1 for south-east Asia).
For drainage related peatland CO2 (excl. extracted peat and fires):
Indonesia emits 0.136 Ce t x 109an-1;
The EU is the second largest emitter with an estimated 0.0474 Ce t x 109 .an-1and Russia, 0.044 Ce. t x 109 an-1).
Total CO2 emissions from the worldwide 500,000km2 of degraded peatland may exceed 0.7 Ce t x 109 an-1. This value is almost 6% of all global carbon emissions.(13, 17)
A differentiation can be made between generally nutrient poor, acidic raised bog peat and often more nutrient and base rich fen peat (Table 4). The lower nutrient content and higher acidity of the bog peat indicates lower methane production and emission.
This is so for boreal peatlands and becomes most obvious when comparing bogs and fen with aerenchymous shunts*. In temperate peatlands no differentiation between bogs and fens can be made on the basis of the available data.
Availability of comparable data for tropical peatlands is still limited.
Current knowledge indicates emissions will be small even after rewetting (<0.5mg
CH4 m2h-1)(16). Rewetting of previously drained peat soils may lead to excessive initial methane emissions when vegetation is flooded and dies off to become substrate for methanogens.
Over a longer period there will be a clear climate benefit from rewetting drained peatlands.
Fermentation is a process used by certain kinds of microorganisms to break down essential nutrients. In a process called acetoclastic methanogenesis, microorganisms from the classification domain archaea produce methane by fermenting acetate and H2CO2 (formic acid) into methane and carbon dioxide:
H3C-COOH CH4 + CO2
Depending on the wetland and type of archaea, hydrogenotrophic methanogenesis, another process that yields methane, can also occur. This process occurs as a result of archaea oxidizing hydrogen with carbon dioxide to yield methane and water:
4H2 + CO2 CH4 + 2H2O
Conclusions
1. The rapid atmospheric increase in GHGs continues, caused primarily by the burning of fossil fuels and cement manufacture.
2. Deforestation(18, 19, 20, 21) and the drainage of peatlands(17) have a large contributory influence on GHG production.
3. The general warming of the global environment and the increasing abundance of atmospheric CO2 have several consequences:
a. an increase in general photosynthetic rate, absorbing atmospheric CO2.
b. an extension in the season of growth in the Northern Hemisphere(1),
c. an increase in the rate of soil respiration(7) and loss of C to the atmosphere at a rate tenfold that of burning fossil fuels and cement manufacture.
d. an increase in the rate of thawing of northern peatlands will itself cause an increased evolution of CH4.
e. the increased rate of evaporation of water from the oceans will increase cloud cover accelerating global warming.
4. The annual loss of C from the global soil as a GHG is at least three times, and soil respiration rate of C at least ten times, the loss caused by fossil fuels and cement manufacture. Therefore a greater control of this soil loss would be expected to have a significant impact upon the rate of climate change.
The role of agroforestry (22) in sequestration of C needs to be quantified and should also have a beneficial impact on the losses under Conclusion 4. We conclude shading of soil brought about by agroforestry could lower its temperature and so reduce microbial activity and GHG production rate.
Solar energy used in heating exposed soil and so stimulating microbial action is used instead for transpiration which requires water to be raised perhaps 20-30 m to the canopy of trees.
Soil respiration rate over the world’s land surface in 2008 was estimated (7) to produce 98 ± 12 t C x 109. A 1 % decrease in this would equal 10 % of the annual GHG produced by burning fossil fuels and cement manufacture.
References
1. Huang, Junling and Michael B. McElroy (2012). “The Contemporary and Historical Budget of Atmospheric CO2” (PDF). Canadian Journal of Physics 90 (8): 707-716.Bibcode:2012CaJPh..90..707H. doi:10.1139/p2012-033.
2. G.P. Peters et al.(2010) Global carbon budget (summary), Tyndall Centre for Climate Change Research
3. Falkowski, P.; Scholes, R. J.; Boyle, E.; Canadell, J.; Canfield, D.; Elser, J.; Gruber, N.; Hibbard, K.; Högberg, P.; Linder, S.; MacKenzie, F. T.; Moore b, 3.; Pedersen, T.; Rosenthal, Y.; Seitzinger, S.; Smetacek, V.; Steffen, W. (2000). “The Global Carbon Cycle: A Test of Our Knowledge of Earth as a System”. Science 290(5490): 291–296. Bibcode:2000Sci...290..291F.doi:10.1126/science.290.5490.291. PMID 11030643.
4. Wallace, John M. and Peter V. Hobbs (2006) Atmospheric Science; An Introductory Survey. Elsevier. Second Edition, 2006. ISBN 978-0-12-732951-2. Chapter 1
5. Forster, P., V. Ramaswamy, P. Artaxo, T. Berntsen, R. Betts, D.W. Fahey, J. Haywood, J. Lean, D.C. Lowe, G. Myhre, J. Nganga, R. Prinn, G. Raga, M. Schulz and R. Van Dorland (2007). “Changes in Atmospheric Constituents and in Radiative Forcing”. In: Climate Change 2007: The Physical Science Basis. Contribution of Working Group I to the Fourth Assessment Report of the Intergovernmental Panel on Climate Change. Solomon, S., D. Qin, M. Manning, Z. Chen, M. Marquis, K.B. Averyt, M.Tignor and H.L. Miller (eds.). Cambridge University Press, Cambridge, United Kingdom and New York, NY, USA.
6. Rice, Charles W. (2002) Carbon in Soil: Why and How? Geotimes (January). American Geological Institute.
7. Bond-Lamberty, B. & Thomson, A. (2010) Temperature-associated increases in the global soil respiration record. Nature 464, 579-582.
8. Lal, R. (2004) Soil Carbon Sequestration Impacts on Global Climate Change and Food Security Science 11 Jun 2004: Vol. 304, Issue 5677, pp. 1623-1627; DOI: 10.1126/science.1097396 : lal.1@osu.edu
9. Dlugokencky, E. (5 February 2016). “Annual Mean Carbon Dioxide Data”. Earth System Research Laboratory. National Oceanic & Atmospheric Administration. Retrieved 12 February 2016.
10. Raich, James W. & Christopher S. Potter (1995) Global patterns of carbon dioxide emissions from soils. Global Biogeochemical Cycles. 9.
11. Lal, Rattan (2010) Managing Soils and Ecosystems for Mitigating Anthropogenic Carbon Emissions and Advancing Global Food Security BioScience 60 (9): 708-721.doi: 10.1525/bio.2010.60.9.8
12. Frampton, Mark W., Paul E. Morrow, Christopher Cox, F. Raymond Gibb, Donna M. Speers, and Mark J. Utell. Effects of Nitrogen Dioxide Exposure on Pulmonary function and Airway Reactivity in Normal Humans (1991) American Review of Respiratory Disease, 143, (March, 1991) No. 3, 522-527.
13. COUWENBERG, JOHN, RENÉ DOMMAIN, & HANS JOOSTEN (2010) Greenhouse gas fluxes from tropical peatlands in south-east Asia. Global Change Biology, 16, Issue 6 June, 1715–1732
14. Trumper, K., Bertzky, M., Dickson, B., van der Heijden, G., Jenkins, M. & Manning, P. (2009) The Natural Fix? The Role of Ecosystems in Climate Mitigation. A UNEP Rapid Response Assessment, United Nations Environment Programme, UNEPWCMC, Cambridge, UK, 65 pp. http://www.unep.org/pdf/BioseqRRA_scr.pdf
15. Couwenberg J, Dommain R, Joosten H (2009) Greenhouse gas fluxes from tropical peatlands in south-east Asia. Global Change Biology, doi: 10.1111/j.1365-2486.2009.02016.x
16. COUWENBERG, J., RENE´ D O M M A I N and H A N S J O O S T E N (2009) Greenhouse gas fluxes from tropical peatlands in south-east Asia. Global Change Biology, doi: 10.1111/j.1365-2486.2009.02016.x,pp 1-18.
17. Joosten, Hans, (2009, 2010) The Global Peatland CO2 Picture Peatland status and drainage related emissions in all countries of the world. Greifswald University, Wetlands International, Ede, August 2010 www.wetlands.org
18. FAO (2010), Forestry Department, Corporate Document. Global Forest Resources Assessment.
19. FAO (2015) assessment of forests and carbon stocks, 1990–2015, I4470E/1/03.15
20. FAO (2001) Forestry Department, Corporate Document Repository State of the World’s Forests (SOFO). Climate change and forests, pp1-12.
21. Brown, Felicity (2009-09-02). “Total forest coverage by country | Environment |Guardian.co.uk”. Guardian. Retrieved 2012-08-19.
22. Zomer, Robert J., Antonio Trabucco, Richard Coe and Frank Place, (2009) Trees on Farm: Analysis of Global Extent and Geographical Patterns of Agroforestry. © World Agroforestry Centre ICRAF Working Paper no. 89, pp 1-64.
Download pdfFigures
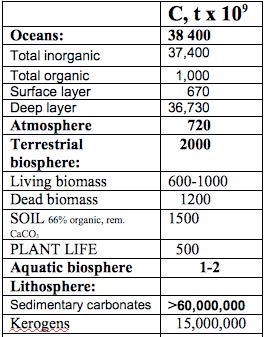
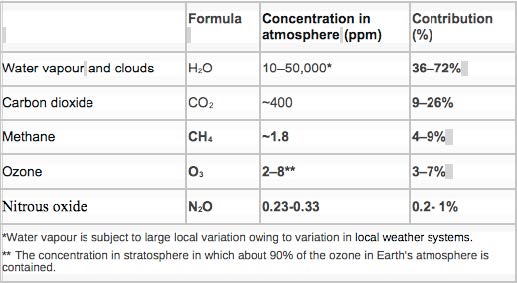
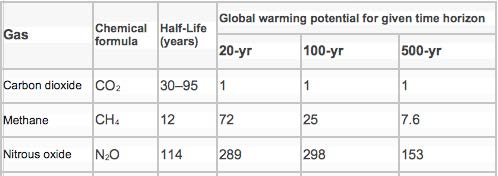
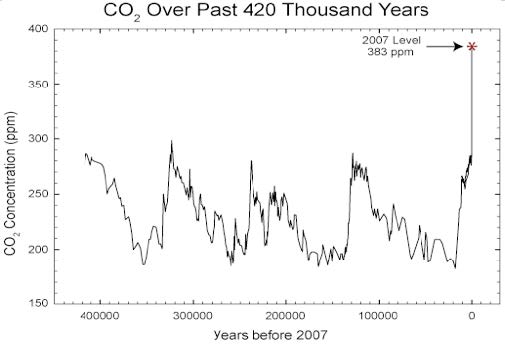
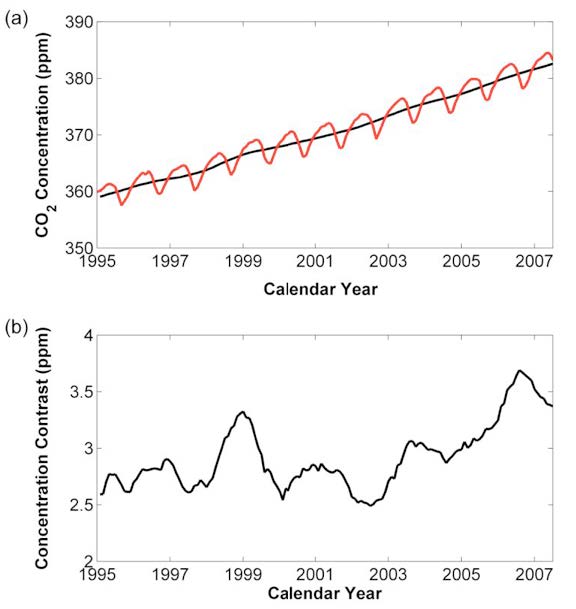
Fig.2. Panel a: Global atmospheric CO2 concentration from 1995 to 2007, in ppm, derived by weighting monthly averages of station data in proportion to the surface area of that appropriate for the latitude zones to which the stations were assigned. The red line is with the seasonal cycle, the black line with the seasonal cycle removed.
Panel b: Hemispheric CO2 contrast (northern hemisphere CO2 concentration minus southern hemisphere concentration) from 1995 to 2007, in ppm, reflecting the fact that fossil fuel combustion is largely concentrated in the northern hemisphere. (1)

Fig 3. 2011, carbon dioxide mole fraction in the troposphere; NASA (9)
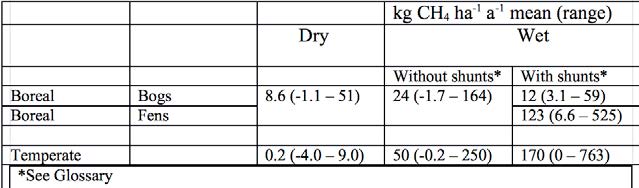
Table 4. Emission factors of methane from peatlands of different types and vegetation. ‘Dry’ means a mean annual water level below -20 cm, ‘Wet’ one above – 20 cm (13)