The functions and sizes of the five carbon sinks on planet Earth and their relation to climate change. Part 3, temperate Deciduous Broad-leaved forests- do they have a role in global warming?
Summary
The comparison of deciduous broad-leaved (DB) with coniferous evergreen (CE) forests, in respect of biodiversity and their effect on climate change, is restricted, as many published comparisons are made between these two forest types in different locations and latitudes.
We have therefore compared each forest type with grassland in the same location to draw conclusions about their relative values at the latitudes of the UK- 50o N-60o N.
The majority of forest carbon, (C), is in the litter and underground, where microbiological activity contributes to CO2, N2O, NO2 and N2 production. There is generally greater activity under DB, where the proportional production of nitrous oxide, N2O, amongst the N gases is greater than under CE.
Differences also occur in their responses to Latitude, ambient temperature and precipitation. Overall the biodiversity of DB forests and of grassland is greater than that of CE forests. Although the published evidence on albedo shows normal variation, the published equations include both the conversion of the albedo effects to radiative forcing, in Watts and the forcing effect of a reduction in atmospheric CO2 equivalent to each unit of forest C sequestrated, in Joules.
The net mean effects for DB and for grassland indicate that DB would need to produce only between 0 and 1.20 tC ha-1yr-1 to have an equaleffect on climate to that of coniferous forests producing 2.5 tC ha-1yr-1 in the UK.
This, together with their greater biodiversity and a higher amenity value indicates that UK forestry policy should encourage more strongly DB plantations. But where DB forestation is envisaged anaerobic conditions should be avoided, especially on N-rich soils to reduce production of methane and, N2O, which are potent greenhouse gases (GHG).
Moreover, an increase in ambient temperature with climate change will increase soil respiration rate tending to mitigate an increase in total C sequestration rate brought about by increasing tree growth rate.
Glossary
Mineralization in soil is decomposition or oxidation of organic matter to plant-accessible forms. Mineralization is the opposite of immobilization.
Soil Nitrification: This is the biological oxidation of ammonia or ammonium ions to nitrite followed by the oxidation to nitrate. The ammonium ion is produced as a waste product from cellular and organismal metabolism and is the preferred N source for many plants and algae. Nitrate is not only a nutrient, but the substrate for the bacterial process of denitrification, by which nitrate is reduced to N2O and N2 gases by soil bacteria. Most plants cannot use N2, so denitrification represents a loss term for fixed N in the ecosystem, but it completes the N cycle.
Carbon (C) to nitrogen (N) ratio: Whether N is mineralized or immobilized depends on the C/N ratio of plant soil residues. These residues have too little N for the microbial population to convert all of the C into their cell structure. If the C:N ratio of this plant material is above 30:1 soil microbes may use N in mineral form (e.g. NO3- ). This N is said to be immobilized, possibly causing N deficiency for trees. As CO2 is released by organic matter decomposition the C:N ratio decreases, and the microbial demand for mineral N is decreased. When the C:N ratio falls below about 25:1 further decomposition results in simultaneous mineralization of N which becomes available for tree growth.
Net ecosystem production (NEP), is the difference between Gross primary production(GPP) and Total ecosystem respiration (Re). NEP is the total amount of organic C in an ecosystem available for storage, or export as organic C.
Gross primary production (GPP) refers to the total amount of C fixed in the process of photosynthesis by plants in an ecosystem. A forest or grassland, for example, may fix 30 tC ha-1 yr-1 during the process of photosynthesis. Total global GPP is about 120 GtC yr -1 (Gifford 1982; Bolin et al. 2000).
Net primary production,( NPP) is GPP minus C respired by plants in autotrophic respiration, NPP = GPP - RA. It constitutes the total annual growth increment (both above and below ground) plus the amounts grown and shed in senescence, reproduction or death of short-lived individuals in a stand plus the amounts consumed by herbivores.
Net Ecosystem Exchange (NEE) and Net Ecosystem Production (NEP) are net primary production minus carbon C in heterotrophic respiration, RH : NEE = NEP = NPP – RH. These terms are interchangeable.
Respiration by Heterotrophs (RH) is the carbon respired by all organisms (flora and fauna) unable to fix C by photosynthesis (includes all animals, protozoans, fungi, and most bacteria) living in the soil and litter decomposing organic matter.
Respiration by Autotrophs (RA) is the energy or C respired for plant metabolism, generally as CO2.
GHG Greenhouse gases
INTRODUCTION
Forestation is assumed to reduce climate warming, as it acts as a C sink lowering atmospheric CO2.
This assumption ignores the large influence caused by the direct warming effect of solar radiation on the Earth’s surface. The considerable variety of surfaces differ greatly in the extent to which that radiation is reflected back into space- their albedo effect.
Evergreen coniferous (CE) forests possess low albedo values, i.e., absorb a high proportion of short wave radiation, so have high radiative forcing values, that is, they tend to warm the Earth more than most alternative land surfaces warm the Earth.
In Part 2 of this series (1) we concluded that the net effect for at least 90 % of UK CE forests (latitudes 50o- 60o N) is positive for net radiative forcing-indicating they warm the climate in comparison to alternative land use.
The reason for this is that C sequestration rate is too low for the consequential reduction in atmospheric CO2 to overcome the positive radiative forcing caused by the low albedo index (i.e. the extent to which radiation is reflected back into space) of CE forests.
It is demonstrated in the review here that Deciduous Broad-leaved (DB) forests reflect more solar radiation back into space than do CE forests and are more biodiverse than CE, but on average have similar rates of C sequestration.
Therefore, United Kingdom (UK) forestry policy should be reviewed to take this evidence into account. In doing so, forest husbandry should also take account of the tendency of the soil microflora of DB forests on N-rich, water saturated, soil to produce high rates of nitrous oxide (N2O), a potent greenhouse gas (GHG).
Impact of broad leaved and coniferous forests
This review of forest productivity has sought to compare the likely impact on climate of DB and CE forests. Although data to allow a strict comparison in a range of climatic and geographic areas are scarce we can conclude that north temperate DB forest is substantially less likely to exacerbate climate warming than CE forest.
This review admits the possibility that land use of proposed development land can affect potential climate change and that these risks need to be considered with the economic and social implications of all infrastructure projects.
The message for politicians, planners and developers is that we should not only seek to maximise planting of DB woodland, but that where sacrifice of woodland for specific projects is essential land covered by CE should be developed in preference to DB and agricultural land, both of which reflect more solar heat back into space.
THE EVIDENCE
Method
In this review we examine reliable evidence concerning temperate deciduous broad-leaved (DB) forests.
Forests are climax vegetation and may be planted as:
-
an amenity;
-
a wind break;
-
timber for building, or fuel;
-
preventing soil erosion in hilly areas;
-
up-stream to reduce flooding risk in the lower reaches of rivers;
-
for biodiversity; and
-
as a carbon sink and/or to change albedo.
The purpose is to assess reliable evidence on items 6 and 7 above. It may be concluded from observation that DB forests are superior to CE for 1, and of similar efficiency for 2-5.
Albedo is an index of the intensity of daily solar short-wave radiation where 0.0 equates to complete absorption by a dark surface and 1.0 complete reflection to space.
We have quantified the reported albedo values in common energy terms, Watts per square metre of land surface, Wm-2, by assuming a value of 13 MJ.m-2d-1 (linear range 11.5-15 see ref. and Appendix), as radiative forcing, allowing 20 % for atmospheric absorption of short-wave radiation.
Thus, the difference in radiative forcing over the whole short-wave spectrum between two different land-use types e.g. grassland and DB forest can be calculated; n.b. positive values for radiative forcing indicate warming the Earth.
This forcing is then compared with the forcing induced by a reduction in atmospheric C brought about by forest C sequestration rate in the same energy terms.
This approach allows a comparison of climate change impacts of the two chosen surfaces. But it does not permit comparison with other drivers of climate change, quantified in different units, e.g. changes in fresh water and food resources and the detrimental effects CO2 exerts through ocean acidification.
The existing definitions of CO2 equivalent are vital for the current policy on climate-change mitigation and should not be discarded. Comparisons of different greenhouse gases from different sources in terms of radiative forcing are still somewhat like the proverbial comparison of apples with oranges.
For example their atmospheric half-lives differ widely. With the exception of half-lives, the other three (high-lighted) extraneous drivers would not affect the conclusions drawn in this review.
The review compares the effects of CE and DB forestation on radiative forcing in the same locations at the latitude of the UK (50-60 N). It is recognized that many local features influence C sequestration in different locations. As some of these could differentially influence C sequestration, forcing and biodiversity between CE and DB in the same location, reference will be made to those of significance to the questions posed.
CLIMATE
LATITUDE
Latitude may be used as a proxy for a range of factors such as radiation balance, length of growing season, frost events and forest nutrition.
Halting deforestation in the tropics would help mitigate climate change through reduced CO2 emissions. It would also help to conserve biodiversity and ecosystem services and maintain a relatively cooler, moister climate by preventing major changes to regional water cycles.
However, at higher latitudes whether forest trees act as a C sink or a C source depends on albedo and net C sequestration rate both of which vary according to climate and vegetation type.
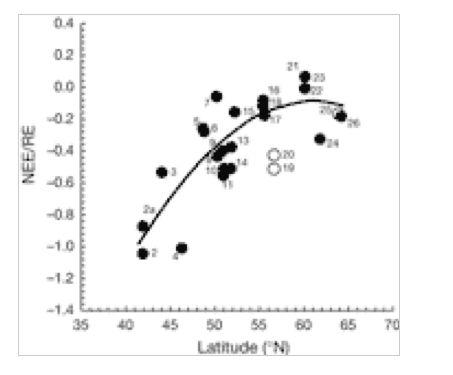
There is a significant decrease in forest C accumulation rate in northerly latitudes. This is caused by a delicate balance between CO2 uptake (photosynthesis) and loss (respiration). Fig. 1 indicates that loss of CO2 to the atmosphere increases greatly at higher latitudes of 15 European forests, whereas Fig. 2 indicates that GPP is uninfluenced by latitude. The ratio NEE/RE increases with latitude (Fig. 3), indicating that respiration rate (RE) becomes more important for northern sites and can explain the decrease of NEE previously shown in Fig. 1. for northern sites. Ecosystem respiration determines NEE(2). Thus, CO2 loss through respiration becomes of increasing importance towards the north pole. It is concluded that an increase in global temperature with climate change is likely to increase soil C decomposition rates more than NPP in cold northern regions. Warm winters tend to switch old boreal stands from a sink to a source of C by increasing the annual amount of respiration (2).
Nutrition and ambient temperature of forests on respiration by non-photosynthetic microorganisms, RH.
Poor nutrition of a forest with a fast rate of C accumulation (GPP) leads to poor overall C sequestration as a higher proportion of energy is respired as CO2 by both green plants and soil microorganisms(3). Increasing ambient temperature substantially increases soil microbial respiration rate(4), but has only a slight positive effect on tree growth. The overall influence on environmental C sequestration of increasing temperature is marginal(5).
BD v CE and Latent heat (LH)
The transfer of LH implies a change in the phase (liquid-gas-solid) without change in temperature, so the energy and heat lost in evapotranspiration cools the surface, but the heat is regained during the condensation of water vapour during cloud formation and its further condensation in rain drops.
The efficiency of CO2 uptake of jack pine is low because a sizable fraction of available radiation is absorbed by non-photosynthetic organs, such as limbs, trunks and soil.
The absorption of solar energy, which energizes evaporation and photosynthesis, are in proportion to total leaf area A boreal jack pine forest has about one-third the leaf area of a BD forest(6) and penetration of about one-third of incident photosynthetic photon flux (QP) to the ground is common in boreal conifer forests (7),whereas temperate BD forests typically intercept between 90 and 95% of solar radiation, QP(8) (Figs. 4, 5, 9 and 10). Thus, the latent heat of evaporation from leaves is greater in BD than in CE forests, cooling the local climate(9,10),
A much higher proportion of net radiation is converted to sensible heat in the pine forest, whereas a higher proportion is converted to latent heat in the BD forest (Fig. 5).
Precipitation and clouds “Half of Earth is covered by clouds of different types, exhibiting reflectivity ranging in albedo from near 0 (heating Earth) to approaching 0.8 (cooling Earth), but becoming a warm blanket at night, reflecting long-wave radiation back to Earth’s surface.” (11)
Effect of forest on rainfall and of rainfall on forest C sequestration rate Temperature has a greater effect on C sequestration rate than rainfall in NE China (12), but soil temperature has only a weak effect(13). The effect of rainfall on C sequestration must be difficult to measure, owing to the depth of rooting; but depending on the scale, forestation generally increases rainfall, although evapotranspiration varies with tree species (14) .
Soil Carbon and Nitrogen stocks and total soil Respiration, Rs
Soil C stocks represent a greater proportion of forest C than that above ground. RS is the flux of microbial and plant respired CO2 from the soil surface to the atmosphere.
There has been an acceleration of this flux with climate change. The global RS in 2008 was 98 ± 12 Pg C. It had increased by 0.1 Pg C yr-1 between 1989 and 2008(15).
It is more than an order of magnitude greater than that of global annual C production from fossil fuel combustion+cement/concrete manufacture (16). The positive correlation of global RS with air temperature could be driven by higher rates of C sequestration, rather than by mobilization of stored carbon.
Nevertheless, whereas the burning of fossil fuels increases the total quantity of C in the biosphere, an increased soil RSwill only increase the rate of cycling in the existent biosphere.
The fact that RS is greater in DB than in CE is a reflection of the greater activity and biodiversity of deciduous soils and does not affect the total C in the biosphere.
Forest net C sequestration rate is found to be overwhelmingly driven by N deposition which is increased by human activities (17,18). The effect is positive over the entire range of N levels (19), as maximum photosynthetic capacity positively correlates with leaf N content (20), canopy scale and albedo in temperate DB species ( 21). N treatment of soils has increased NPP and NEP (22,23, 24,25) in both CE and DB species. NEP and NPP include soil C sequestration. But what gases are released? RS is largely CO2. What other GHGs are present?
Leaves of DB trees are rich in nutrients leading to nutrient-rich soils, (figure 6) (26). So Net N soil mineralisation is greater under DB c.f. CE, as it increases with higher levels of microbial C and N biomass (27,28). Leaf-litter decomposition rate is decreased greatly by a high lignin:N ratio of leaf litter(29, 30). The litter layer of CE forests is rich in lignin and thick, but well aerated favouring slow nitrification and release of NO. Conversely, the proportionally rapid rates of denitrification in DB forests owe to a compact, moist litter layer, leading to NO consumption and nitrous oxide (N2O) production (31,32, 33), especially with a rising temperature (34, 35) , if substrate, or moisture, is not limiting (36,37). A review of world data shows that over half global atmospheric N2O originates from the soil (38A) and that although N addition increases the global terrestrial C sink, the consequential CO2 reduction could be offset 53-76% by N stimulation of global CH4 and N2O emissions (38B). Atmospheric N2O accounts for approximately 5% of the global greenhouse effect and destroys stratospheric ozone.
Thus, N enrichment of soil may beneficially increase C sequestration rate and albedo index of DE forests; but it also increases the production of potent GHG, methane and nitrous oxide, especially with damp anaerobic soils. These factors must be taken into account in any policy review.
Conclusions
1. Effect on climate of DB and CE forests as measured by the sum of C sequestration rate and albedo.
Although we are concerned here with the rate of C sequestration the total ecosystem (vegetation, detritus and soil) C content, as a sink is of concern. In the boreal study (BOREAS) it is greatest in the black spruce forests (460 kg3 C ha-1), with 87 to 88% of the C in the soil, and is lowest in the jack pine stands (69 kg3 C ha-1), as representing northern coniferous forests, with a similar distribution of C in the vegetation and soil. A total of 57 % of world-wide forest C is in the soil (39).
C sequestration rates range from 2.5 to 7 t C ha-1 yr-1 over Europe and the USA. The highest values are for young (20-50 years), fast-growing coniferous plantations and broad-leaved trees. NPP values of up to 4.5 t C ha-1 yr-1 for Sitka spruce in a maritime environment (40),1.7 to 3.6 t C ha-1 yr-1 for European beech and mixed deciduous forests, and 2.5 to 3.4 t C ha-1 yr-1 for Norway spruce forests in Central Europe and 3.4 t C ha-1 yr-1 for fir in the northwest USA (41) and 4.7 t C ha-1 yr-1 for several species of DB and 2.7 t C ha-1 yr-1 for CE species. (39) . Overall it is concluded and assumed that rates of C sequestration are similar for DB and CE forests growing under similar conditions for growth.
Mean minimum and maximum albedo values for crops, pasture and DB have a similar range: 0.19–0.27 whereas CE has a substantially lower range: 0.09-0.14. The mean difference between DB and CE ranges from 0.052 to 0.115 (figure 7, European and figure 8, North American data). These values are consistent with those in other reports (42 ,43).
DB would only need to sequestrate C at a rate of 0 to 1.20 tC ha-1yr-1 to have an equaleffect on climate to that of coniferous forests producing 2.5 tC ha-1yr-1 in the UK (figures 7 and 8 and Appendix).
Appendix
The calculation: The value 5.35 (W m−2 ) converts from units of CO2 to radiative forcing, ∆RE,(48,49) in the removal of 1 tC from the atmosphere. 1 ppm (moles) of CO2 concentration corresponds to 2.123 GtC (50)
With an atmospheric CO2 concentration of 390 ppm, and for the whole Earth, the radiative forcing, ∆RE, of the removal of 1 tonne forest carbon is −104 GJ tC−1 yr−1(43).
We cautiously assume a mean annual incident solar radiation of 13.0 MJ m−2 d −1. Then compare the radiative forcing of −104 GJ tC−1 yr−1 with an albedo difference between two land use types of 379.6 GJ ha−1 yr−1, equivalent to an annual radiative forcing, per 1 % difference (assuming linearity). Thus, the required amount of C storage needed, B, to balance the increase in albedo from each 1% increase in radiation absorption is, B = 379.6/−104, i.e. −3.65 tC ha−1.
In accord with our previous paper (1) we assume a C sequestration rate of 2.5 tC.yr-1. for both DB and CE. (A different value would not affect the conclusions). Moreover, as we are comparing forests with equal production rates of C, feedback from oceans etc. may be ignored. (figure 7, European data and figure 8, North American data).
European Reports (see figure 7)
1) ∆Ryr = 13.0×(+0.01)(1−0.2)×10000×365 = +3796 GJha–1yr-1 and +3796/-104 = -36.5 tC.ha-1 .
For (DB)–(Grassland) the DB woodland would not have to produce timber for equivalence, as its albedo is greater than that of comparative grassland.
2) ∆Ryr = 13.0×(-0.105)(1−0.2)×10000×365 = -3985.8 GJha–1yr-1 and -3985.8/-104 = +38.33 tC.ha-1. For (CE)-(Grassland), the CE forest growing at a rate of 2.5 tC.ha-1yr-1, it would take >15 years to achieve equivalence with grassland.
3) DB forest would not need to produce any timber in order to have a similar effect on climate to a CE forest sequestrating at a rate of 2.5 tC.ha-1yr-1 according to European data.
North American Reports (see figure 8)
4) ∆Ryr = 13.0×(-0.0480)×(1−0.2)×10000×365 = -1822.08 GJha–1yr-1 and -1822.08/-104 = +17.52 tC.ha-1 . For (DB) – (Grassland), at 2.5 tC.ha-1 +17.52/2.5, this value can be accommodated within 7 years.
5) ∆Ryr = 13.0×(-0.0998)×(1−0.2)×10000×365 = 3788.41 GJha–1yr-1 and -3788.41/-104= +36.43 tC.ha-1 . For (CE) – (Grassland), at 2.5 tC.ha-1yr-1this value can be accommodated within 15 years.
6) DB forest would need to sequestrate C at a rate of only (17.52/36.43)(2.5 tC.ha-1yr-1) =1.20 tC.ha-1yr-1 order to equal the rate of C sequestration of a CE forest sequestrating at a rate of 2.5 tC.ha-1yr-1, in accordance with N. American data.
References
2. R. Valentini1, G. Matteucci1, A. J. Dolman2, E.-D. Schulze3,4, C. Rebmann3,4, E. J. Moors2, A. Granier5, P. Gross5, N. O. Jensen6, K. Pilegaard6, A. Lindroth7, A. Grelle8, C. Bernhofer9, T. Gr|[uuml]|nwald9, M. Aubinet10, R. Ceulemans11, A. S. Kowalski11, T. Vesala12, |[Uuml]|. Rannik12, P. Berbigier13, D. Loustau14, J. Gu|[eth]|mundsson15, H. Thorgeirsson15, A. Ibrom16, K. Morgenstern16, R. Clement17, J. Moncrieff17, L. Montagnani18, S. Minerbi19 & P. G. Jarvis (2000) Respiration as the main determinant of carbon balance in European forests. Nature 404, 861-865 (20 April 2000) doi:10.1038/35009084; Received 12 January 2000; Accepted 3 March 2000.
3. Fernández-Martínez, M., Vicca, S., Janssens, I. A., Sardans, J., Luyssaert, S., Campioli, M.,Peñuelas, J. (2015). Reply to 'Uncertain effects of nutrient availability on global forest carbon balance' and 'Data quality and the role of nutrients in forest carbon-use efficiency'. Nature Climate Change, 5(11), 960-961. DOI: 10.1038/nclimate2794
4. Sims, D. A., Rahman, A. F., Cordova, V. D., El-Masri, B. Z., Baldocchi, D. D., Bolstad, P. V., Flanagan, L. B., Goldstein, A. H., Hollinger, D. Y., Misson, L., Monson, R. K., Oechel, W. C., Schmid, H. P., Wofsy, S. C. & Xu, L.(2008) Apr 15 2008 In : Remote Sensing of Environment. 112, 4, p. 1633-1646 14 p
5. Peter B. Reich and Paul Bolstad (2001) . 11. Productivity of evergreen and deciduous temperate forests. in Terrestrial and Global Productivity (2001)pp. 249-283. Academic press.
6. A. D. McGuire, J. M. Melillo, L. A. Joyce, D. W. Kicklighter, A. L. Grace, B. Moore III, and C. J. Vorosmarty (1992) Interactions between carbon and nitrogen dynamics in estimating net primary productivity for potential vegetation in North America. Global Biogeochemical Cycles 6, Issue 2, 101–124.
7. Perttu, K., W. Bischof, H. Grip, P. E. Jansson, A. Lindgren, A. Lindroth, and B. Noren, (1980) Micrometeorology and hydrology of pine forest ecosystems, IField studies, in Structure and Function of Northern Coniferous Forests--An Ecosystem Study, edited by T. Persson, Ecol. Bull., 32, 75-121.
8. Baldocchi, D., and Collineau, S. 1994. The physical nature of solar radiation in heterogeneous canopies: Spatial and temporal attributes. In: Exploitation of Environmental Heterogeneity by Plants. Ecophysiological Processes Above-and Belowground. M. M. Caldwell and R. W. Pearcy (eds.), pp. 21–71. San Diego: Academic Press.
9. Baldocchi, D. D., and C. A. Vogel (1996) A comparative study of water vapor, energy and CO2 flux densities above and below a temperate broadleaf and a boreal pine forest, Tree Physiol., 16, 5-16
|
10. WHO, (2017) Climate Change and Land |
|
|
IPCC special report on climate change, desertification, land degradation, sustainable land management, food security, and greenhouse gas fluxes in terrestrial ecosystems |
|
11. NASA (2011)"Baffled Scientists Say Less Sunlight Reaching Earth". LiveScience. 24 January 2006. Retrieved19 August 2011. albedo-effect - Wix.com leftytimber.wixsite.com/albedo-effect, 11NASA albedo-effect - Wix.com leftytimber.wixsite.com/albedo-effect.
12. Shan Gao, Tao Zhou, Xiang Zhao, Donghai Wu, Zheng Li, Hao Wu, Ling Du and Hui Luo. (2016) Age and climate contribution to observed forest carbon sinks in East Asia. Environ. Res. Lett. 11 (2016) 034021, 1-11. doi:10.1088/1748-9326/11/3/034021.
13. Desai, A. R., B. R. Helliker, P. R. Moorcroft, A. E. Andrews, and J. A. Berry (2010), Climatic controls of interannual variability in regional carbon fluxes from top‐down and bottom‐up perspectives, J. Geophys. Res., 115, G02011, doi:10.1029/2009JG001122).
14 UK Met Office, Hadley Centre (2015) Climate: Observations, projections and impacts www.metoffice.gov.uk/climate-guide/science/science-behind-climate. 27 July, 2015.
15. Ben Bond-Lamberty1 & Allison Thomson (2010) Temperature-associated increases in the global soil respiration record. Nature, 464, 579-582, 25 March 2010. doi:10.1038/nature08930
16.Huang, Junling, and Michael Brendon McElroy. (2012). The contemporary and historical budget of atmospheric \(CO_2\). Canadian Journal of Physics 90(8): 707-716. Published Version doi:10.1139/p2012-033
17. Schlesinger (2009) On the fate of anthropogenic nitrogen. January 6, 2009, 106 no. 1, 203-208.
18. Galloway J. N., Townsend A. R., Erisman J. W., Bekunda M., Cai Z. C., Freney J. R., Martinelli L. A., Seitzinger S. P., Sutton M. A. (2008). Transformation of the nitrogen cycle: recent trends, questions, and potential solutions. Science 320, 889–89210.1126/science.1136674.
19. Federico Magnani , Maurizio Mencuccini , Marco Borghetti , Paul Berbigie , Frank Berninger , Sylvain Delzon , Achim Grelle , Pertti Hari , Paul G. Jarvis , Pasi Kolari , Andrew S. Kowalski , Harry Lankreijer , Beverly E. Law , Anders Lindroth , Denis Loustau , Giovanni Manca, John B. Moncrieff , Mark Rayment , Vanessa Tedeschi , Riccardo Valentini & John Grace, (2007), The human footprint in the carbon cycle of temperate and boreal forests, Nature, 447, 14 June 2007 doi:10.1038/nature05847.
20. FIELD C, MOONEY HA. 1986. THE PHOTOSYNTHESIS-NITROGEN RELATIONSHIP IN WILD PLANTS. PP 25-55 IN T. GIVNISH (ED) ON THE ECONOMY OF PLANT FORM AND FUNCTION. Gasper Ridge Biological Preserve. Publ. Cambridge Univ. Press 1986.
21. Megan K. Bartlett,a* Scott V. Ollinger,b David Y. Hollinger,c Haley F. Wicklein,b Andrew D. Richardson (2011)
Canopy-scale relationships between foliar nitrogen and albedo are not observed in leaf reflectance and transmittance within temperate deciduous tree species. Botany, 89(7): 491-497 https://doi.org/10.1139/b11-037
22. Zhihong Du, Wei Wang ,Wenjing Zeng, and Hui Zeng (2014) Nitrogen Deposition Enhances Carbon Sequestration by Plantations in Northern China. PLOS ONE ,https://doi.org/10.1371/journal.pone.0087975
23 Michael B. Walters and Peter B. Reich (2000) SEED SIZE, NITROGEN SUPPLY, AND GROWTH RATE AFFECT TREE SEEDLING SURVIVAL IN DEEP SHADE. Ecology, 81, Issue 7,1887–1901
24 Federico Magnani , Maurizio Mencuccini , Marco Borghetti , Paul Berbigie , Frank Berninger , Sylvain Delzon , Achim Grelle , Pertti Hari , Paul G. Jarvis , Pasi Kolari , Andrew S. Kowalski , Harry Lankreijer , Beverly E. Law , Anders Lindroth , Denis Loustau , Giovanni Manca, John B. Moncrieff , Mark Rayment , Vanessa Tedeschi , Riccardo Valentini & John Grace, (2007), The human footprint in the carbon cycle of temperate and boreal forests, Nature, 447, 14 June 2007| doi:10.1038/nature05847.
25. R. Q. Thomas1,2, G. B. Bonan2 , and C. L. Goodale (2013) Insights into mechanisms governing forest carbon response to nitrogen deposition: a model–data comparison using observed responses to nitrogen addition. Biogeosciences, 10, 3869–3887, 2013 www.biogeosciences.net/10/3869/2013/ doi:10.5194/bg-10-3869-2013.
26. Davi Rodrigo Rossatto, Fabrício Alvim Carvalho and Mundayatan Haridasan (2015) Soil and leaf nutrient content of tree species support deciduous forests on limestone outcrops as a eutrophic ecosystem. Acta Bot. Bras., 29 no.2 Belo Horizonte Apr./June 2015 http://dx.doi.org/10.1590/0102-33062014abb0039.
27. Bauhus, J.D., D. Pare and L. Cote. 1998. Effects of tree species, stand age, and soil type on soil microbial biomass and its activity in a southern boreal forest. Soil Biol. Biochem. 30: 1077–1089.
28. L. Coté, S. Brown , D. Paré, J. Fyles, J. Bauhus (2000) Dynamics of carbon and nitrogen mineralization in relation to stand type, stand age and soil texture in the boreal mixedwood. Soil Biology & Biochemistry 32 (2000) 1079±1090.
29. Harmon. I.E.. Baker. G.A., Spycher, G.. and Greene. S.E. (1990). Leaf-litter decomposition in the Picea Tsuga forests of Olympic National Park. Washington, U.S.A. For. Ecol. Manage., 31: 55- 66.
30. Scott, N.A. and D. Binkley (1997) Foliage litter quality and annual net N mineralization: comparison across North American forest sites. Oecologia 111:151–159.
31. Schindlbacher, A., Zechmeister-Boltenstern, S., and Butterbach-Bahl, K.: Effects of soil moisture and temperature on NO, NO[2], and N[2]O emissions from European forest soils, J. Geophys. Res., 109, D17, doi:10.1029/2004JD004590, 2004.
32. Kesik, M., N. Brὕggemann, R. Forkel, R. Kiese, R. Knoche, C. Li, G. Seufert, D. W. Simpson, and K. Butterbach-Bahl (2006), Future scenarios of N2O and NO emissions from European forest soils, J. Geophys. Res., 111, G02018, doi:10.1029/2005JG000115.
33. K. Pilegaard1, U. Skiba2, P. Ambus1, C. Beier1, N. Brüggemann3, K. Butterbach-Bahl3, J. Dick2, J. Dorsey4, J. Duyzer5, M. Gallagher4, R. Gasche3, L. Horvath6, B. Kitzler7, A. Leip8, M. K. Pihlatie9, P. Rosenkranz3, G. Seufert8, T. Vesala9, H. Westrate5, and S. Zechmeister-Boltenstern. (2006) Factors controlling regional differences in forest soil emission of nitrogen oxides (NO and N2O). Biogeosciences, 3, 651-661, https://doi.org/10.5194/bg-3-651-2006, 2006.
34 Rahman, Mohammed Mahabubur, Tsukamoto, Jiro, Rahman, Md. Motiur, Yoneyama, Aogu, Mostafa, Kamal Mohammad (2013) Lignin and its effects on litter decomposition in forest ecosystems. Chemistry in ecology 29 no.6 pp. 540-553.
35 Schaufler, G., Kitzler, B., Schindlbacher, A., Skiba, U., Sutton, M.A., ZechmeisterBoltenstern, S., 2010. Greenhouse gas emissions from European soils under different land use: effects of soil moisture and temperature. Eur. J. Soil Sci. 61, 683–696
36 Meixner, F. X., and W. X. Yang (2006), Biogenic emissions of nitric oxide and nitrous oxide from arid and semi-arid land, in Dryland Ecohydrology, edited by P. D’Odorico and A. Porporato, pp. 233 – 256, Springer, Dordrecht, Netherlands.
37 Wang Y, Wang CK, Fu MJ, Liu S, Wang XC. (2009) Soil nitrous oxide emission in four temperate forests in northeastern China. Ying Yong Sheng Tai Xue Bao. May;20 (5):1007-12.
38A Alfi Syakila & Carolien Kroeze (2011)The global nitrous oxide budget revisited. Greenhouse Gas Measurement and Management 1, Issue 1, 17-26.
38B Liu L1, Greaver TL (2009) A review of nitrogen enrichment effects on three biogenic GHGs: the CO2 sink may be largely offset by stimulated N2O and CH4 emission. Ecology Letters. 2009 Oct;12(10):1103-17. doi: 10.1111/j.1461-0248.2009.01351.x. Epub 2009 Aug 20.
39 S. T. Gower, • J. G. Vogel, and T. K. Stow • 1 j. M. Norman, 2 C. J. Kucharik, 2 S. J. Steele and Stow, T.K. (1997). Carbon distribution and aboveground net primary production in aspen, jack pine, and black spruce stands in Saskatchewan and Manitoba, Canada. JOURNAL OF GEOPHYSICAL RESEARCH, 102, NO. D24, 29,029-29,041.
40 Jarvis P.G. (1981) Production efficiency of coniferous forest in the UK. In: Johnson CB (ed.) Physiological processes limiting plant productivity. Butterworths, London, p 81–107.
41 Spiecker H., Mielikainen K., Kohl M. and Skovsgaard G. (1996) Growth trends in European forests. Springer-Verlag, Heidelberg.
42. Alan K. Betts; John H. Ball (1997) Albedo over the boreal forest. Atmospheric Research, Pittsford, Vermont JOURNAL OF GEOPHYSICAL RESEARCH, 102, NO. D24,28,901-28,909, DECEMBER 26. Atmospheric Research, Pittsford, Vermont.
43. M. U. F. Kirschbaum1 , D. Whitehead2 , S. M. Dean3 , P. N. Beets4 , J. D. Shepherd1 , and A.-G. E. Ausseil, (2011). Implications of albedo changes following afforestation on the benefits of forests as carbon sinks. Biogeosciences, 8, 3687–3696, 2011 www.biogeosciences.net/8/3687/2011/ doi:10.5194/bg-8-3687-2011.
44. Lutz Breuer∗, Klaus Eckhardt, Hans-Georg Frede (2003) Plant parameter values for models in temperate climates. Ecological Modelling, 169, Ecological Modelling 169 (2003) 237–293237–293.
45. J. Otto1 , D. Berveiller2 , F.-M. Bréon1 , N. Delpierre2 , G. Geppert3 , A. Granier4 , W. Jans5 , A. Knohl6 , A. Kuusk7 , B. Longdoz4 , E. Moors5 , M. Mund6 , B. Pinty8 , M.-J. Schelhaas5 , and S. Luyssaert1, (2014) Forest summer albedo is sensitive to species and thinning: how should we account for this in Earth system models? Biogeosciences, 11, 2411–2427, 2014 www.biogeosciences.net/11/2411/2014/ doi:10.5194/bg-11-2411-2014.)
46. David Y. Hollinger (2013) FINAL REPORT Climate change consequences of forest management practices NSRC Theme 3: Forest Productivity and Forest Products USDA Forest Service, Northern Research Station USA
47. D. Y. HOLLINGER *, S. V. OLLINGER w , A. D. RICHARDSON w , T. P. M E Y ER S z, D. B. DAIL§, et al. (2009) Albedo estimates for land surface models and support for a new paradigm based on foliage nitrogen concentration. Global Change Biology (2009), doi: 10.1111/j.1365-2486.2009.02028.
48. Harvey, L. D. D., Gregory, J., Hoffert, M., Jain, A., Lal, M., Leemans, R., Raper, S., Wigley, T., and de Wolde, J. (1997) An introduction to simple climate models used in the IPCC Second Assessment Report, Intergovernmental Panel on Climate Change, Technical Paper II, 50 pp., 1997. Harvey, L. D. D., Gregory, J., Hoffert, M., Jain, A., Lal, M., Leemans, R., Raper, S., Wigley, T., and de Wolde, J.: An introduction to simple climate models used in the IPCC Second Assessment Report, Intergovernmental Panel on Climate Change, Technical Paper II, 50 pp.
49. Ramaswamy, V., Boucher, O., Haigh, J. D., Hauglustaine, D., Haywood, J., Myhre, G., Nakajima, T., Shi, G. Y., and Solomon, S. (2001) Radiative Forcing of Climate Change, in: Climate Change 2001: The Scientific Basis. Contribution of Working Group I to the Third Assessment Report of the Intergovernmental Panel on Climate Change, edited by: Houghton, J. T., Ding, Y., Griggs, D. J., Noguer, M., van der Linden, P. J., Dai, X., Maskell, K., and Johnson, C. A., Cambridge University Press, Cambridge, UK and New York, NY, USA, 349–416.
50. Joos, F., Bruno, M., Fink, R., Siegenthaler, U., Stocker, T. F., Le Quere, C., and Sarmiento, J. L. (1996) An efficient and accurate representation of complex oceanic and biospheric models of anthropogenic carbon uptake, Tellus, 48B, 397–417.
Download pdfFigures
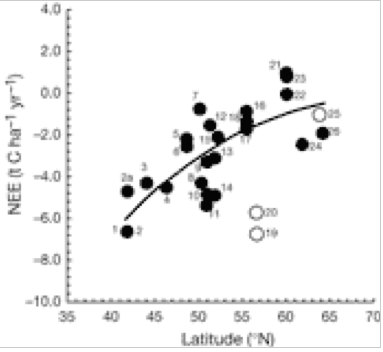
Net Ecosystem Exchange (NEE) v latitude. Closed symbols, forest of natural origin and planted stands with traditional European forest management; open symbols, intensively managed plantations. A negative sign indicates that C is absorbed by forest as Carbon sequestration (growth). A positive sign indicates C is released by forest to the atmosphere as CO2(2).
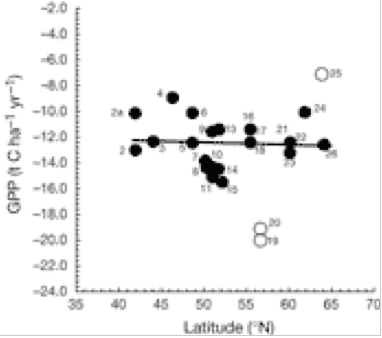
Gross primary production (GPP) plotted against latitude . A negative sign indicates C is absorbed by the 15 European forest. A positive sign indicates C is released by forest to the atmosphere as CO2 (2).
NEE/RE (Net ecosystem exchange/total ecosystem respiration) Closed symbols, natural forest; open symbols, intensively managed European plantations. A negative sign indicates C is absorbed by forest. A positive sign indicates C is released by forest to the atmosphere(2).
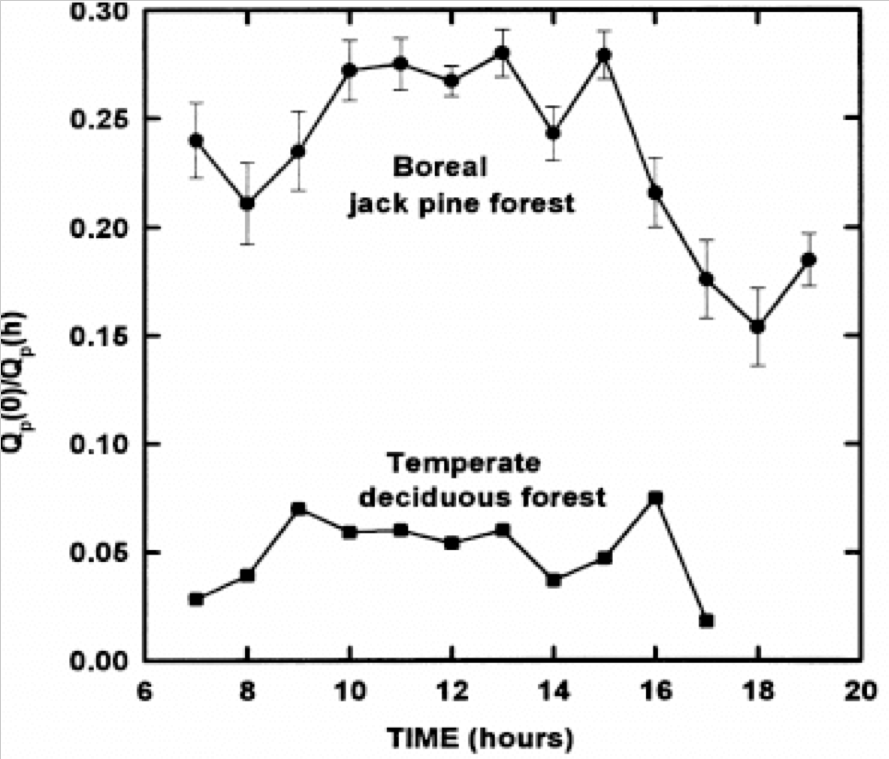
Photosynthetic photon flux (QP) reaching the forest floor during the day in a jack pine (53°92′ N) and a temperate BD forest (35°57′30″ N) (9)
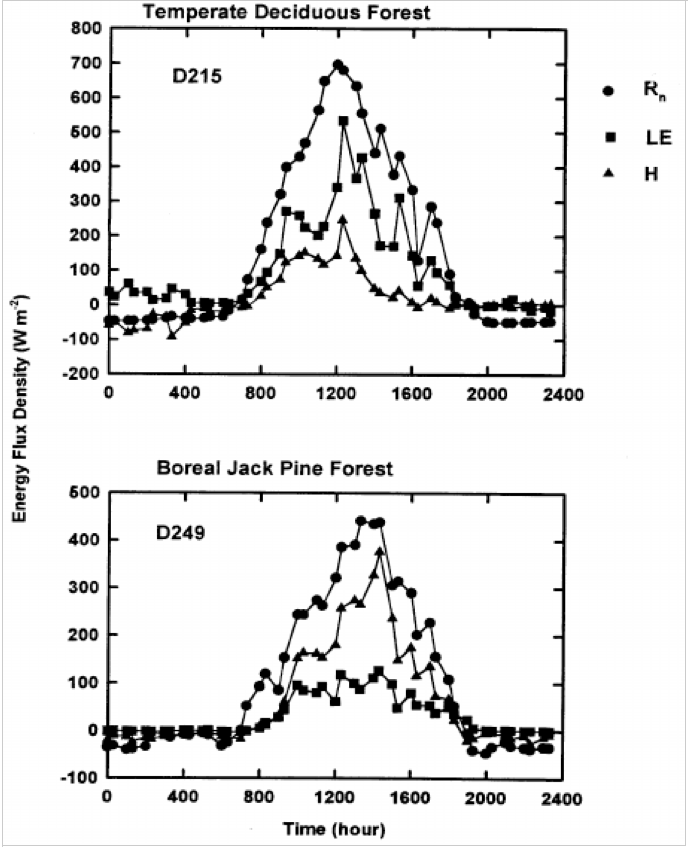
Daily variations of net radiation ( Rn ), and latent (LE) and sensible heat (H) flux densities over a temperate BD forest and a boreal jack pine forest. (9).
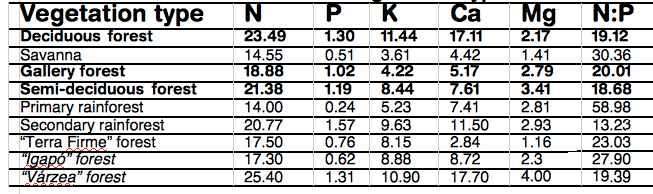
Average leaf nutrient concentration (g.kg-1) and N:P ratio for deciduous forest and other vegetation types I Brazil (26)
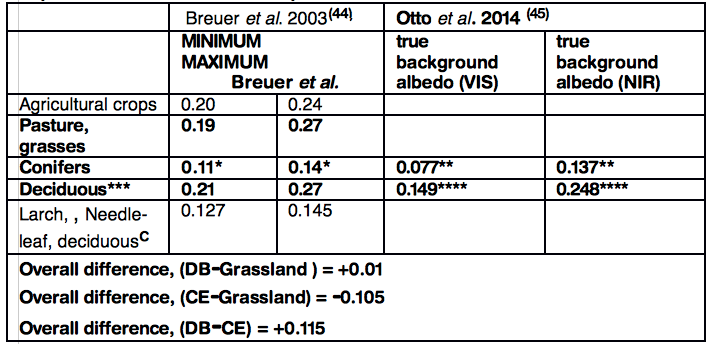
Albedo values, crops, grasses CE and DB. Data from two European reports 0-1.0, VIS, visible spectrum, NIR, near infra-red
*19 data sets in Breuer et al. review(44)
** CE, Pinus sylvestris (45)
***38 data sets in Breuer et al. review(44)
****Mean DB, Fagus spp ,Quercus robur & Q. petraea(45)
C Deciduous needle-leaf (larch, Larix laricina) albedo variation exceeded that of CE species and overlaps the albedo range of BD species.
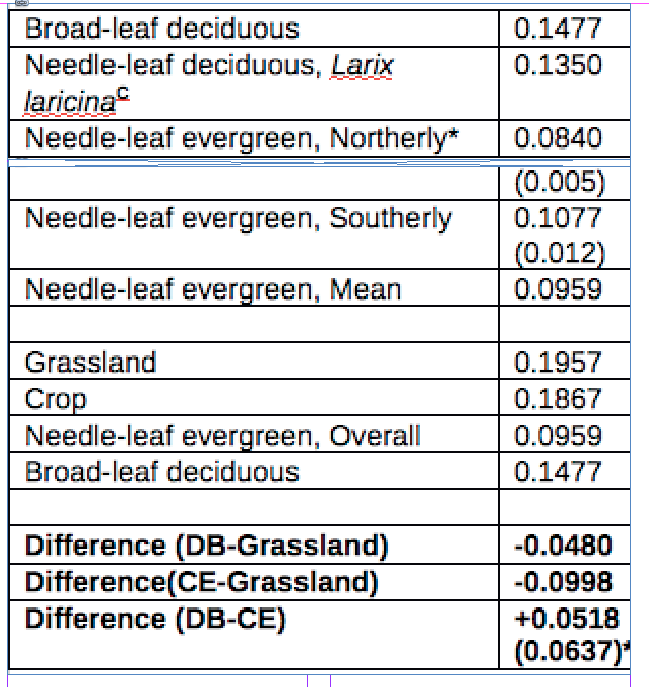
Mean Albedo estimates for land surface models. (46,47)
*Northerly would be more akin to UK latitudes, but 0.0518 is used cautiously in calculation.
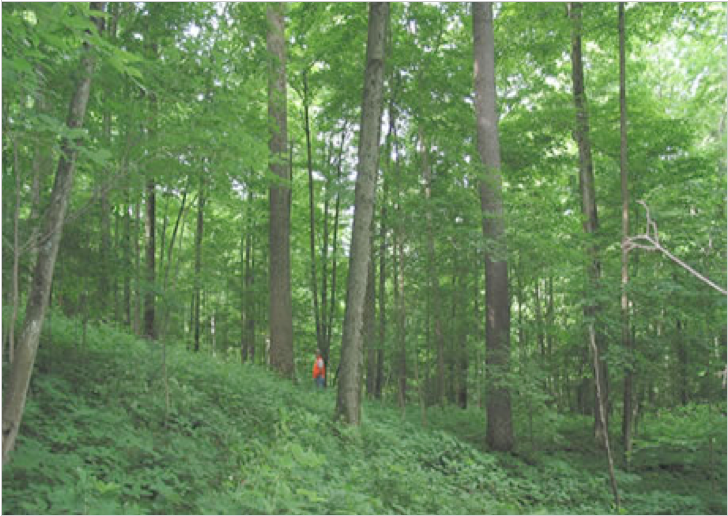
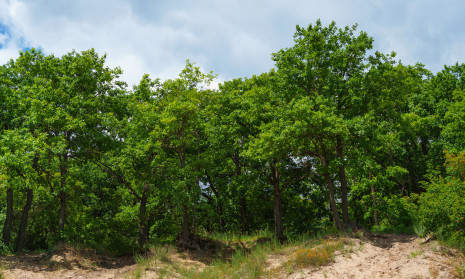
A, Deciduous broad-leaved temperate productive stand.
Photo Richard Hovatter, USDA Forest Service
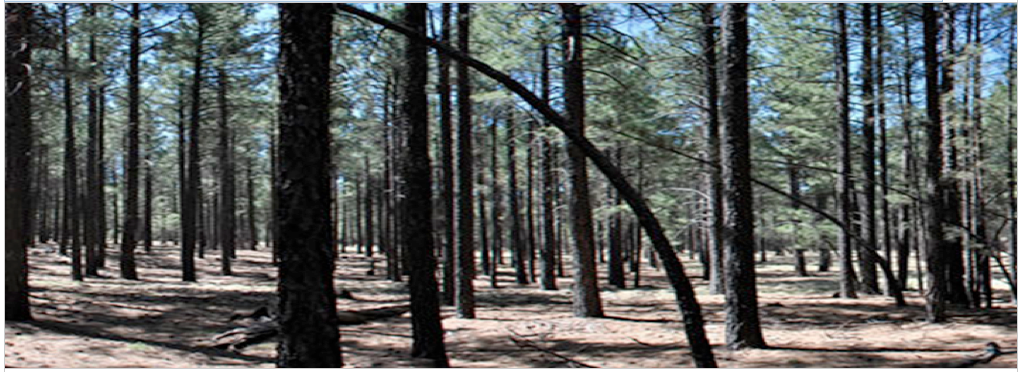
Coniferous evergreen forest (Ponderosa pine), Taylor Woods, Fort Valley
Experimental Forest. Photo, Alessandra Bottero, University of Minnesota