
Methods for Increasing Sustainability of Agro-ecosystems Based on the Ecological Footprint in China

(College of Resources and Environmental Sciences, China Agricultural University, Beijing 100193, China)
Abstract: Sustainability of agro-ecosystems plays an important role in regional ecological safety and food security. As an ecological accounting tool, the ecological footprint (EF) is widely adopted to assess the sustainability of a given region, nation or industrial sector.
As a virtual area, the EF initially does not reflect the real ecological conditions of the home region. However, for the agro-systems, a reduction of external inputs per unit of agricultural product can directly or indirectly decrease the EF of the home area. The results of the EF research show that China has achieved great growth of agricultural production between 1980 and 2010, while intensive practices have correspondingly decreased sustainability of the agro-ecosystems. Fortunately, the agro-systems have become more sustainable during the last decade.
Technological innovations aimed at green production and consumption, low-carbon ways of life and sustainable trade are increasing the sustainability of the agro-ecosystems by improving farmland biophysical productivity and decreasing its EF. In future, the EF accounting of the agro-systems should focus on micro level, such as products, technological changes, trade policies and ecological compensation for net losses of natural capital. A set of effective measures integrating new technologies and policies with them have been taken to improve the sustainability of agro-ecosystems in China.
Ecological Footprint (EF) is a measure of consumption within a geographically defined population and provides an indicator of the impact of the consumption by that population on the environment. It represents the land area necessary to sustain current levels of resource consumption and waste discharge by that population or individual. Generally, the components of the Footprint include cropland, forestland, fishing grounds, grazing land, built-up area and carbon footprint, expressed as ha per capita (The EF per capita can be regarded as a sustainability index to measure the total hectares needed to support one individual in a given region):
EF= N×ef (1)
ef=∑γAi, Ai=Ci/Pi, (2)
where N is the population size in a given region or nation, ef is average per capita ecological footprint, γ is equivalence factors, C is average annual consumption of product each item per capita and Pi is average annual production or yield of that item. For example, the total and per capita’s EF of food consumption of Beijing City in 2011 can be seen in Table 1[1,2,3,12,15,33,53,54].
Ecological Footprint Analysis (EFA) is an area-based indicator which quantifies the intensity of resource use and waste discharge in a specified area in relation to the area's capacity to provide for that activity[6].
gha is a global hectare, which is equal to 1 ha with productivity equal to the average productivity of the total global bioproductive ha. The hectares for each type of bioproductive area include cropland, pasture, forest, fisheries, built-up area and fossil fuels are converted into global hectares by weighting their productivity against the world average productivity. This conversion is calculated using equivalence factors, which capture the productivity difference among land-use categories and among yield factors, capturing the difference between local and global average productivity within a given land-use category.
EQi =Pi/TP, TP= (3)
where EQi is equivalence factor of a certain land type, Pi is the average productivity for that land type in the world (or a certain nation), and TP is the average productivity of all five kinds of land use in the world (or a certain nation), where wi is the weight of each kind of land use. The equivalence factors in the world and China in 2010 can be seen in Table 2[3,12,15,33].
Biocapacity (BC) refers to the amount of biologically productive land and water areas available within the boundaries of a given country, and their productivity. Biocapacity is calculated for each of the five major land use types: cropland, grazing land, fishing grounds (marine and inland waters), forest, and built-up land, expressed as gha per capita. Biocapacity can change from year to year due to climate, ecosystem management, soil conditions and agricultural inputs.
BC=∑(Ai×EQi×YFi) (4)
where Ai is the area of each land type, EQi is equivalence factors, YFi is yield factor (all these factors are constant value from 2010). For example, the total and per capita’s biocapacity of farmland of Beijing City in 2011 can be seen in Table 3[1,2,3,12,33,53,54].
Biocapacity Deficit or Biocapacity Remainder(BD or BR)is the difference between the Biocapacity (BC) and Ecological Footprint (EF) of individual, region or country.
BD or BR =BC-EF (5)
A biocapacity deficit occurs when the EF of a population exceeds the biocapacity of the area available to that population. Conversely, a biocapacity remainder exists when the biocapacity of a region exceeds its population’s EF. If there is a regional or national biocapacity deficit, it means that the region is importing biocapacity through trade or liquidating regional ecological assets. For example, the biocapacity deficit or remainder of food consumption of Beijing City in 2011 is given in Table 4[3,12, 33,53,54].
The BD per capita of food consumption in Beijing City means more 0.8894 gha per person of farmland elsewhere than that of Beijing City is capable. The city needs to support its food consumption by regional food trade. But the global biocapacity deficit cannot be compensated through trade, and is therefore equal to overshoot.
Carbon Footprint (CF) measures the total amount of GHG (Greenhouse Gas, primarily CO2, CH4, and N2O) emissions that are directly and indirectly caused by an activity or are accumulated over the life cycle of products, goods and services.
CF=∑(Ii×EFi) (6)
where Ii is the quantity of the ith input or resource, EFi is the emission factor of the ith input or resource. This includes activities of individuals, populations, governments, companies, organizations, processes, industry sectors, etcMathis Wackemagel, William E. Rees. Perceptual and structural barriers to investing in natural capital: Economics from an ecological footprint perspective [J]. Ecological Economics, 1997, 20: 3-24,WWF.2016. Living Planet Report 2016 [R]. World Wildlife Fund for Nature. Gland, Switzerland.,Galli A, Wiedmann T, Ercin E, Knoblauch D,Ewing B,Giljum S. Integrating ecological, carbon and water footprint into a "footprint family" of indicators: definition and role in tracking human pressure on the plant [J]. Ecological Indicators, 2012,16: 100-112.,Ecological footprints Network. [EB/OL]..
Water Footprint (WF) of an individual, community or business is defined as the total volume of freshwater used to produce the goods and services consumed by the individual or community, or produced by the business.
WF=WCi/Yi (7)
where WCi is the water consumption of the ith goods or service, Yiis the quantity of the ith goods or service. The Water Footprint of a nation is defined as the total amount of water used to produce the goods and services consumed by the inhabitants of the nationMathis Wackemagel, William E. Rees. Perceptual and structural barriers to investing in natural capital: Economics from an ecological footprint perspective [J]. Ecological Economics, 1997, 20: 3-24,WWF.2016. Living Planet Report 2016 [R]. World Wildlife Fund for Nature. Gland, Switzerland.,Galli A, Wiedmann T, Ercin E, Knoblauch D,Ewing B,Giljum S. Integrating ecological, carbon and water footprint into a "footprint family" of indicators: definition and role in tracking human pressure on the plant [J]. Ecological Indicators, 2012,16: 100-112.,Ecological footprints Network. [EB/OL]..
Emergy is defined as the energy of one type required in transformations to generate a flow and storage. Emergy was originally used by H.T. Odum, an ecologist of United States of America to evaluate the work previously done to make a product or service, which was described as the available energy (exergy) of one kind previously required to be used up directly and indirectly to make the product or service.
Emergy (seJ)=energy or mass (J or g)×transformity (seJ/J,g) (8)
where seJ is solar Emjoules; transformity is transformation coefficient (each kind of materials or energy can be transfered into solar Joules, transformity refers to the total embodied solar Joules of per unit of materials or energy). Emergy synthesis (ES) is an ecological accounting method used to comprehensively and adequately account all the inputs, involving energies, natural resources consumption and financial payments for human by using similar units And now, this concept is used in ecological footprint analysis by some scholarsBrown M T, Ulgiati S. Emergy measures of carrying capacity to evaluate economic investments [J]. Population Environment, 2001,22: 472-501.,Chen GQ, Jiang MM, Chen B, Yang ZF, Lin C. Emergy analysis of Chinese agriculture [J]. Agriculture Ecosystems & Environment, 2006, 115: 161-173..
Projects with advanced technologies launched in the last decade in China
The Project of Formula Fertilization by Soil Testing was launched from 2005, aimed at increasing yield of crop by special fertilizer according to soil testing results, promoting the farmers’ income, while reducing the quantity of fertilizer application.
The Farmland Landscape Construction Project was launched around 2005, aimed at increasing biological habitats and protecting biodiversity, designing landscape pattern and maintaining ecological safety.
The Well-Facilitated Farmland Project was launched from 2012, aimed at enlarging the scale of farmland, improving the farmland facilities, increasing yield of farmland and promoting the ability of natural disaster prevention.
Introduction
Ecological Footprint (EF) as an ecological accounting tool, was originally proposed by Rees and developed by Wackernagel and Rees in the 1990s to study urban economy with ecological viewsRees W E. Ecological footprint and appropriated carrying capacity: what urban economics leaves out [J]. Environment and Urbanization, 1992, 4(2): 121-130.
Ecological footprint analysis (EFA) is an intuitively simple and imaginative method to measure sustainability gap between natural capital and population consumptionRees W E., Wackernagel M. Urban ecological footprints: why cities can not be sustainable and why they are a key to sustainability [J].
Environmental Impact Assessment Review, 1996, 16: 223-248,Mathis Wackemagel, William E. Rees. Perceptual and structural barriers to investing in natural capital: Economics from an ecological footprint perspective [J]. Ecological Economics, 1997, 20: 3-24,Wackernagel M, Monfreda C, Sehulz N B. Calculating national and global ecological footprint time series: resolving conceptual challenges [J]. Land Use Policy, 2004, 21(3): 271-275.
Calculations of the EF have been made to evaluate the impact at different scales, from personal to city, regional, country and global levelsRedefining Progress, 1999. http://www.lead.org/leadnet/footprint/ intro.htm.-WWF.2016. Living Planet Report 2016 [R]. World Wildlife Fund for Nature. Gland, Switzerland..
For example, the global overshoot (-8,618.06 million gha, is the difference between the EF and biocapacity at global scale) was 0.71 times of the biocapacity of the World (12,208.92 million gha) in 2013 and our planet is thus not sustainable WWF.2016. Living Planet Report 2016 [R]. World Wildlife Fund for Nature. Gland, Switzerland..
The EF has also been used to study the sustainability of food systems and agricultureVan der Werf H M G, Tzilivakis J, Lewis K, Basset-Mens C. Environmental impacts of farm scenarios according to five assessment methods [J]. Agriculture Ecosystems Environment, 2007, 118(1): 327-338.,Blasi E, Passeri N, Franco S, Galli A. An ecological footprint approach to environmental–economic evaluation of farm results [J]. Agricultural Systems, 2016, 145: 76-82.
Cuadra and Björklund assessed the ecological carrying capacity of six crop systems in NicaraguaCuadra M, Björklund J. Assessment of economic and ecological carrying capacity of agricultural crops in Nicaragua [J]. Ecological Indicators, 2007, 7(1): 133-149.
Blasi et al. applied an innovative approach based on the EF to evaluate the environmental impact of a crop system at the farm levelBlasi E, Passeri N, Franco S, Galli A. An ecological footprint approach to environmental–economic evaluation of farm results [J]. Agricultural Systems, 2016, 145: 76-82.
Nevertheless, the EF methodology showed some limitations. This method was incapable of identifying any under/over exploitation of natural resources originating from crop farmingMózner Z, Tabi A, Csutora M. In the quest for the sustainable agricultural yield-comparing the environmental impacts of intensive and extensive agricultural practices [J]. Ecological Indicators, 2012, 16: 58-66.-Galli A. On the rationale and policy usefulness of Ecological Footprint Accounting: the case of Morocco [J]. Environmental Science Policy, 2015, 48: 210-224.
Thus the method was unsuitable for the evaluation and for the correct assessments of agricultural sustainabilityFerng J. Local sustainable yield and embodied resources in ecological footprint analysis-a case study on the required paddy field in Taiwan [J]. Ecological Economics, 2005, 53: 415-430.,Fiala N. Measuring sustainability: why the ecological footprint is bad economics and bad environmental science [J]. Ecological Economics, 2008, 67: 519-525..
Other researchers developed and revised the EF method, and made it possible to overcome the problem, using the revised method of calculating the EF of cropsBlasi E, Passeri N, Franco S, Galli A. An ecological footprint approach to environmental–economic evaluation of farm results [J]. Agricultural Systems, 2016, 145: 76-82.,Passeri N, Borucke M, Blasi E, Francoc S, Lazarusb E. The influence of farming technique on cropland: A new approach for the Ecological Footprint [J]. Ecological Indicators, 2013, 29(6): 1-5.. Over the last decades, some novel approaches, including Ecosystem-Service-based Ecological Footprint (ESEF), Carbon Footprint (CF), Water Footprint (WF) and Nitrogen Footprint (NF), have emerged to assess the influence of human activities on ecological systemsGalli A, Wiedmann T, Ercin E, Knoblauch D,Ewing B,Giljum S. Integrating ecological, carbon and water footprint into a "footprint family" of indicators: definition and role in tracking human pressure on the plant [J]. Ecological Indicators, 2012,16: 100-112.. Because EF methodology is improved by life cycle assessment (LCA), input-output analysis, three-dimensional modeling, net primary productivity, emergy theory and time series analysis, it is now becoming comparatively mature and widely adopted in the WorldZhou T, Wang Y P, Gong J Z, Wang F, Feng Y F. Ecological footprint model modification and method improvement [J]. Acta Ecologica Sinica, 2015, 35( 14) : 4592-4603.,Cao Shuyan, Xie Gaodi, ChenWenhui, Guo Hong. Ecological footprint of raw and derived agricultural products [J]. Journal of Natural Resources, 2014, 29(8): 1336-1344.
As a land-based surrogate measure of the population’s demands on natural capital, EF was introduced to China in the late 1990s. Since the early 2000s (Fig.1), EFA has received more attention and is widely applied to a variable extent to Chinese industries Cao Shuyan, Xie Gaodi, ChenWenhui, Guo Hong. Ecological footprint of raw and derived agricultural products [J]. Journal of Natural Resources, 2014, 29(8): 1336-1344-Sun Yanzhi, Shen Lei. Bibliometric analysis on research progress of four footprint methodologies in China [J]. Jounrnal of Natural Rseource, 2016, 31(9):1463-1473 (in Chinese).. Modified models specific to the agricultural field have been developed in the last decade.
These have focused on the revised framework for agriculture and the method improved for the sustainable development of China’s agricultural practices Cao Shuyan, Xie Gaodi, ChenWenhui, Guo Hong. Ecological footprint of raw and derived agricultural products [J]. Journal of Natural Resources, 2014, 29(8): 1336-1344,Chen GQ, Jiang MM, Chen B, Yang ZF, Lin C. Emergy analysis of Chinese agriculture [J]. Agriculture Ecosystems & Environment, 2006, 115: 161-173.,Zhao Sheng, Li Zizhen, Li Wenlong. A modified method of ecological footprint calculation and its application [J]. Ecological Modelling, 2005, 185(1): 65-75.. However, no significant innovation has been achieved, although this outcome does not affect the potential of EFA to measure the sustainability of agro-ecosystems.
Purpose of this paper
Recognizing the key role of sustainability of Agro-systems, this paper reviews the recent advances in EF research in the agricultural sector in China. It presents the latest iteration of an accounting tool to track the status and trend of the EF of agro-ecosystems.
This paper explains the conceptual confusion and put forward the research questions underlying assessment of the EF. It also focuses on how to reduce the EF and increase biocapacity of the agro-ecosystems at different levels and on measures to improve the sustainability of agro-ecosystems in China. Finally, this paper proposes suggestions and strategies for guiding appropriate decisions on policies and practices of sustainable development of the agro-ecosystems.
Sustainability and equity
EF uses an ecological productive land area as the indicator to identify the sustainability of given region by measurement of the ecological deficit and ecological reserve (Box 1), however, both of them do not reflect the real ecological conditions of the home regions because the EF is actually expressed as a virtual area. In other words, a region with an ecological deficit doesn’t mean ecological overload, conversely, a region with ecological reserve doesn’t mean there is no ecological damage.
For example, according to the data of Global Footprint Network (GFN)Ecological footprints Network. [EB/OL]., the ecological deficit of United States of America (USA) in 2013 was 4.81 gha per person with 3.78 gha per person of biocapacity and 8.59 gha per person of EF, compared with 2.66 gha per person with 0.93 gha per person of biocapacity and 3.59 gha per person of EF in China.
Although this might indicate that the USA is less sustainable than China, the ecological pressure and environmental impact of farmland in China were more serious than in the USA. The explanation is that China has used per ha 2-3 times the world average amount of fertilizer, pesticide and irrigation and also uses a multiple-cropping system with a comparatively low utilization efficiency of agricultural resourcesMonfreda C, Wackernagel M, Deumling D. Establishing national natural capital accounts based on detailed Ecological Footprint and biological capacity assessments [J]. Land Use Policy, 2004, 21(3): 231-246.-David Norse, Ju Xiaotang. Environmental costs of China’s food security [J]. Agriculture, Ecosystems Environment, 2015, 209: 5-14..
The EF difference between America and China represented higher consumption of products per capita owing to global trade and better land biophysical productivity in America. These apparent anomalies indicate a need for an objective understanding of the EF from a global perspective.
Most research results indicate a positive correlation between economic development and the EFRees W E., Wackernagel M. Urban ecological footprints: why cities can not be sustainable and why they are a key to sustainability [J]. Environmental Impact Assessment Review, 1996, 16: 223-248,Zhao Sheng, Li Zizhen, Li Wenlong. A modified method of ecological footprint calculation and its application [J]. Ecological Modelling, 2005, 185(1): 65-75.,Zhou Xiaoyan, Zhan Wenyan, YE Xinyue, Gan Tian, Han Xiang. Bibliometric analysis of ecological footprint research during 1992-2012 [J]. Progress in Geography, 2014, 33(3): 333-346 (in Chinese).,Sun Yanzhi, Shen Lei. Bibliometric analysis on research progress of four footprint methodologies in China [J]. Jounrnal of Natural Rseource, 2016, 31(9):1463-1473 (in Chinese).
The developed regions (or nations) have appropriated more than their fair share of Earth’s carrying capacity. On the other hand, ecological occupancy occurs in developing areas where total consumptions among these trading regions exceed aggregate sustainable production. In this sense, EF’s definition of sustainability involves not only the difference between the EF and biocapacity, but also equity among related trading regions in global scale.
Generally, we can reduce the EF deficit and promote the entire planet’s sustainability through lower population, lower consumption, more efficient technologies, higher biophysical productivity, or a combination of these four parametersMathis Wackemagel, William E. Rees. Perceptual and structural barriers to investing in natural capital: Economics from an ecological footprint perspective [J]. Ecological Economics, 1997, 20: 3-24. However, for the agro-systems, reducing external inputs per unit of agricultural product (not product consumption per capita) and improving the land biophysical productivity can directly or indirectly decrease the EF of the home region or nation.
Decreasing ecological load on farmland by reducing external inputs
Then, what is happening in Chinese agro-systems based on the EF? At regional level and level of the cropland system in China, most studies indicate ecological load and ecological costs have risen and ecological efficiency has declined between 1980 and 2010 owing to the large quantity of inputs of nonrenewable resources per unit of farmland area, including chemical fertilizer, pesticide, machines and irrigationChen GQ, Jiang MM, Chen B, Yang ZF, Lin C. Emergy analysis of Chinese agriculture [J]. Agriculture Ecosystems & Environment, 2006, 115: 161-173.,Chen Dongdong. Ecological cost evaluation on agroecosystem based on ecological footprint analysis: methods and cases studies [D]. China Agricultural University, 2008.,Duan Qiling. Regional difference of ecological footprints of cropland in Jiangsu Province based on emergy analysis [J]. Porgress in Geography, 2008, 27(4): 96-102 (in Chinese).,Li J, Liu Z, He C, Tu W, Sun Z. Are the drylands in northern china sustainable? a perspective from ecological footprint dynamics from 1990 to 2010 [J]. Science of the Total Environment, 2016, 553: 223-231.. Chen made an ecological analysis of Chinese agriculture for the period from 1980 to 2000 using emergy analysis.
Temporal variation of indices such as increasing environmental load ratio (ELR), decreasing emergy self-support ratio (ESR) and decreasing emergy yield ratio (EYR) illustrated a weakening sustainability of the Chinese agro-ecosystem. There has been a transition from a self-supporting local farming to a more intensive modern industry based on non-renewable resource consumptionChen GQ, Jiang MM, Chen B, Yang ZF, Lin C. Emergy analysis of Chinese agriculture [J]. Agriculture Ecosystems & Environment, 2006, 115: 161-173.. For example, in 2008, an ecological cost account of agricultural production in Luancheng based on a modified EFA showed ecological costs rose while ecological efficiency declined over the last 30 yearsChen Dongdong. Ecological cost evaluation on agroecosystem based on ecological footprint analysis: methods and cases studies [D]. China Agricultural University, 2008.
Duan considered the ecological footprint of cropland from 6 types of land use, focused on the regional differences in Jiangsu Province. He revised the ecological carrying capacity with a productivity factor because land use efficiencies vary across regions and then used the ecological gap index (EGI) in place of ecological deficit or remainder to evaluate the ecological sustainability. The results showed ecological gap indices of cropland of all 13 regions in Jiangsu were lower than 0.5.
This means croplands were unsustainableDuan Qiling. Regional difference of ecological footprints of cropland in Jiangsu Province based on emergy analysis [J]. Porgress in Geography, 2008, 27(4): 96-102 (in Chinese).. Similarly, Li et al. indicated that the drylands in northern China (DNC) had already become unsustainable after the rapid increases of EF and water withdrawal from 1990 to 2010. The EF had increased from 0.35 in 1990 to 1.26 billion gha in 2010 with an annual increase of 6.6%, the corresponding values of water withdrawal were 133.29 km3 and 153.23 km3 Li J, Liu Z, He C, Tu W, Sun Z. Are the drylands in northern china sustainable? a perspective from ecological footprint dynamics from 1990 to 2010 [J]. Science of the Total Environment, 2016, 553: 223-231.
Chinese authorities realized that high external input would lead to unsustainable agricultural production and decided to implement the strategy of green production (with lower external inputs and more use of renewable resources). One of most important measures is the Project of Formula Fertilization by Soil Testing launched in 2005. Zhao et al. adopted the EEF (Emergetic Ecological Footprint) to evaluate the winter wheat-summer maize rotation system before and after use of formula fertilization by soil testing in Huantai County, Northern China.
The results showed that the Resource Load Index (RLI) decreased by 4.02%, Environmental Load Index (ELI) decreased by 27.90%, System Externality (SE) decreased by 8.06%, while the Sustainability Index (SI) increased by 9.64%. These results indicate that the non-point source pollution in Huantai County has been controlled remarkably in the past decade by reducing chemical fertilizer and irrigation.
However, the consumption of resources and the environmental pressure of grain production still remain at a high level so that continued effort is needed to reduce non-point source pollution Zhao Guishen, Wang Yichao,Tang Xiaowei, et al. Evaluation of sustainability for intensive farmland ecosystem based on emergy ecological footprint [J]. Transactions of the Chinese Society of Agricultural Engineering, 2014, 30(18): 159-167.. In brief, a reduction in use of nonrenewable resources is the pivotal measure to promote the sustainability of agro-ecosystems.
Improving biocapacity by technological innovation
Technological innovation to make farmland more fertile and safe is the essential way to increase ecological capacity although whether this will reduce EF remains uncertain. EF does not initially take into account of technological advances.
Each region has inherently its own different levels of biophysical productivity which determines ecological capacity of a given region and maintains the life-support functions of its ecosphere. However, technological innovation can change biophysical productivity.
The question then becomes: “what will happen on earth in terms of sustainability of a given region as a result of technological innovation?” In brief, whether a region runs an ecological deficit or an ecological reserve depend on the type of technology. Some advanced technologies speed up the rate of resource exploitation and increase consumption per capita.
By contrast, the technologies aimed at increasing the net primary productivity and a reduction of primary consumption per capita may improve ecological reserve by low-carbon ways of life and a strategy of green development of the home region and decrease appropriating carrying capacity elsewhere.
In China, a series of projects integrating advanced technologies have been launched in the last decade, such as the Project of Formula Fertilization by Soil Testing, the Farmland Landscape Construction Project and the Well-Facilitated Farmland Project (Box 2). A total of 153 site-year field experiments conducted from 2009 to 2012 in China showed that a set of integrated soil-crop system management can significantly increases average yields of main staple crops (rice, wheat and maize).
If farmers could achieve grain yields of 80% of the optimized experimental yield level by these new technologies, it would reduce nitrogen use, reactive nitrogen losses and GHG (Greenhouse Gas) emissions by 21%, 30% and 11% respectively, compared with current levelsChen Xinping, Cui Zhenling, Fan Mingsheng, et al. Producing more grain with lower environmental costs [J]. Nature, 2014, 514: 486-489.
Chinese authorities originally put forward the new word ‘Eco-friendly Agriculture’ in No.1 Central Document in 2014 to encourage green production in agriculture. In 2015, the Project of Organic Fertilizer Substituting for Chemical Fertilizer and Bio-control Substituting for Pesticide was launched throughout the whole country.
This project focuses on new technologies such as formula fertilization by soil testing, integrated nutrient resource management, bio-pesticides and integrated pest management to realize Two Zero-Growths (zero-growth of fertilizer application and zero-growth of pesticide application) in China. It is hoped that these approaches will improve the biocapacity of farmland and reduce its EF.
Developing a circular economy in agriculture
The need to ensure food security for a growing population while minimizing environmental impact is an important topic in China. Results have shown that extensive use of renewable resources and promotion of a circular agriculture and circular economy are effective measures to reach several objectives by combining farming and animal husbandrySu B W, Heshmati A, Geng Y, Yu X M. A review of the circular economy in China: moving from rhetoric to implementation [J]. Journal of Cleaner Production, 2013, 42(3): 215-227.,Chen Lihong, Cong Ronggang, Shu Bangrong, Mi Zhfu. A sustainable biogas model in China: The case study of Beijing Deqingyuan biogas project [J]. Renewable Sustainable Energy Reviews, 2017, 78: 773-779.. Xi and Pei applied the emergy evaluation method to analyze the resource use and environmental impact of organic rice-duck mutualism (an agro-ecosystem in which ducks and rice share the common field with mutual benefit) by comparison with a conventional wheat-rice rotation system on the same farm.
They evaluated the sustainability of rice-duck system. The results showed that the rice-duck system produced greater emergy benefits, and used greater reliance on the farmer’s initiative, lower environmental pressure and higher product safety Xi YG, Pei Q. Emergy evaluation of organic rice-duck mutualism system [J]. Ecological Engineering, 2009, 35 (11): 1677-1683.. Chen summarized the economic and environmental performance of the biogas-linked agrosystem (BLAS) in China. An emergy synthesis is utilized to evaluate the overall BLAS and its four subsystems, including planting, breeding, aquaculture and the biogas subsystem.
The results showed that emissions mitigation, energy efficiency and system sustainability are positively correlated within BLAS Chen Shaoqing, Chen Bin. Sustainability and future alternatives of biogas-linked agrosystem (BLAS) in China: an emergy synthesis [J]. Renewable and Sustainable Energy Reviews, 2012, 16: 3948-3959.. Liu et al. made a sustainable assessment of four methods for use of maize straw by using an assessment of the emergetic ecological footprint.
They found that the “straw-dairy-biogas-straw (S-D-B-S, index 0.81)” was more sustainable that other approaches. These involved direct return of straw to the soil, straw use for biogas or straw use by dairy cow. The longer circulation chains corresponded with improved sustainabilityLiu Z, Wang D, Ning T, Zhang S, Yang Y, He Z. Sustainability assessment of straw utilization circulation modes based on the emergetic ecological footprint [J]. Ecological Indicators, 2017, 75: 1-7.. Consequently, they recommended that the integrated-biogas subsystem should be developed and all agricultural wastes should be used more efficiently in order to increase the sustainability.
The value of agricultural biodiversity
Biodiversity including genetic diversity, species diversity, community diversity and landscape diversity are important to reduce the ecological footprint. There is no doubt that biodiversity conservation and utilization also become key strategies for sustainable development in agriculture.
The EF of agro-systems should be carefully controlled through sustainable development to mitigate further degradation of the ecosystem servicesButler S J, Vickery J A, Norris K. Farmland biodiversity and the footprint of agriculture [J]. Science, 2007, 315: 381-384.. Otherwise, the biophysical productivity of farmland will decrease.
This will inevitably lead to a lower ecological carrying capacity than that of agro-systems is capable of providing. Zhu et al. have taken advantage of genetic diversity of rice to control disease successfully over many years in South China. The result showed that rice blast (a fungal disease caused by Magnaporthe grisea) of susceptible rice varieties planted in mixtures with resistant varieties had 89% greater yield and blast was 94% less severe than when they were grown in monocultureZhu Youyong, Chen Hairu, Fan Jinghua et al. Genetic diversity and disease control in rice [J]. Nature, 2000, 406: 718-722.. Consequently, species diversity has been explored and widely applied in different crops.
These technologies have brought about a result of increased yield while reducing fertilizer, pesticide and fungicides use and the sustainability of the agro-ecosystems has significantly improvedZhu Youyong, Chen Hairu, Fan Jinghua et al. Genetic diversity and disease control in rice [J]. Nature, 2000, 406: 718-722.,Li L, Sun J H, Zhang F S, et al. Wheat/maize or wheat/soybean strip intercropping: I. Yield advantage and interspecific interactions on nutrients [J]. Field Crops Research,2001, 71(2): 123–137,Li L, Li S M, Sun J H, et al. Diversity enhances agricultural productivity via rhizosphere phosphorus facilitation on phosphorus-deficient soils [J]. Proceedings of the National Academy of Sciences of the United States of America, 2007, 104(27): 11192–11196.. In addition, research also showed that the restoration of the pre-existing biodiversity is of crucial importance in degraded agricultural areas. In field margins, sowing strips of wildflowers or grasses has shown ecological benefits in terms of long-term sustainability of agricultural productivityStefano Benvenuti, Francesca Bretzel. Agro-biodiversity restoration using wildflowers: what is the appropriate weed management for their long-term sustainability? [J]. Ecological Engineering, 2017, 102: 519-526..
Sustainable trading balance for minimizing Ecological Footprint
The ecological load of a given region can be reduced by importing from other areas. Ferng measured Taiwan's rice and wheat consumption footprints in terms of cropland and energy land from 1989 to 2008Ferng J J. Measuring and locating footprints: a case study of Taiwan's rice and wheat consumption footprint [J]. Ecological Economics, 2011, 71(1): 191-201.
Taiwan had continuously enlarged and dispersed the cropland for its rice and wheat consumption footprints in foreign countries, and had decreased its footprint in domestic territories. By examining these findings within their local context, this study identified and discussed related sustainability challenges that the local department facesFerng J J. Measuring and locating footprints: a case study of Taiwan's rice and wheat consumption footprint [J]. Ecological Economics, 2011, 71(1): 191-201.. Kissinger and Dan analyzed the ecological footprint of grain-based consumption in the state of Israel during the last two decadesKissinger M, Dan G. From global to place oriented hectares-the case of Israel's wheat ecological footprint and its implications for sustainable resource supply [J]. Ecological Indicators, 2012, 16: 51-57.
They found while the overall consumption of grain products had increased throughout the period, the size of the footprint had been dropping as a consequence of changing sources of supply and grain composition. As Kissinger mentioned, in today's world, any nation's ecological footprint is spread all over the globe Kissinger M, Dan G. From global to place oriented hectares-the case of Israel's wheat ecological footprint and its implications for sustainable resource supply [J]. Ecological Indicators, 2012, 16: 51-57.,Meidad Kissinger, Approaches for calculating a nation’s food ecological footprint—The case of Canada [J]. Ecological Indicators, 2013, 24: 366-374.
Thus, utilizing international trade to realize the diversification of grain supply sources is a popular strategy. Specific to China, we should adjust agricultural structure to achieve the double objectives, namely food security and ecological safety. Therefore, we should restrict and reduce the planting area of high water-consuming and low output crops. Enlarging food supply sources and adjusting the structure of agricultural imports and exports are urgent and necessary strategies.
Conclusion
It is considered more important to minimize the sustainability gap of the home region or nation between EF and BC compared with that of the globe. The reason is that the EF cannot directly reflect the true ecological situations of the home area, especially in agriculture or other industrial sectors.
As we know, agro-ecosystems in China face severe challenges in the EF as a consequence of the rising population, limited agricultural resources and environmental degradation. To improve the sustainability of Chinese farmland, it is critical that China understands the guiding function of EF and its contribution to global and domestic sustainability.
There is a need for EF research at the micro levels such as to individuals, families, enterprises and products; evaluation of the impact on EF caused by technological changes; EF trading or marketing policies and ecological compensation for net losses of natural capitalMathis Wackemagel, William E. Rees. Perceptual and structural barriers to investing in natural capital: Economics from an ecological footprint perspective [J]. Ecological Economics, 1997, 20: 3-24. Technological innovations focused on green production and consumption, adoption of a low-carbon ways of life and more sustainable trade play key roles in improving sustainability of the agro-ecosystems in ChinaZhang Shuang, Li Zhoukui. The ecological footprint analysis of Beijing based on resource consumption [J]. Research of Soil and Water Conservation, 2014, 21(1): 294-298 (in Chinese)..
We recommend adoption of the following measures:
(1) technological innovation in eco-friendly fertilizer, pesticide and water management and also increasing the efficiency of agricultural inputs.
(2) to learn more from traditional agriculture through integrated management systems for farming and animal husbandry, biodiversity conservation and utilization;
(3) to enlarge the scale of production of green food (reduced use of fertilizer and pesticide) and organic products by establishing special protection areas;
(4) to encourage farmers and food enterprises to label their products with the Carbon and Water Footprint and encourage individuals and families to consume more sustainable products;
(5) to launch ecological restoration projects, or a fallow system to increase the net primary productivity or biophysical carrying capacity of the farming ecosystem; and
(6) to import agricultural products that have a higher natural resources consumption on the premise of domestic food security, such as wheat (imported from nations with comparatively abundant water and other resources), realizing the higher use efficiency of native natural resources for more sustainable agro-systems.
References
-
Rees W E. Ecological footprint and appropriated carrying capacity: what urban economics leaves out [J]. Environment and Urbanization, 1992, 4(2): 121-130.
-
Rees W E., Wackernagel M. Urban ecological footprints: why cities can not be sustainable and why they are a key to sustainability [J]. Environmental Impact Assessment Review, 1996, 16: 223-248
-
Mathis Wackemagel, William E. Rees. Perceptual and structural barriers to investing in natural capital: Economics from an ecological footprint perspective [J]. Ecological Economics, 1997, 20: 3-24
-
Wackernagel M, Monfreda C, Sehulz N B. Calculating national and global ecological footprint time series: resolving conceptual challenges [J]. Land Use Policy, 2004, 21(3): 271-275.
-
Redefining Progress, 1999. http://www.lead.org/leadnet/footprint/ intro.htm.
-
Wackernagel M, Rees W E. 1996. Our ecological footprint. reducing human impact on the Earth[M]. The New Catalyst, Bioregional Series. New Society Publish, Canada.
-
Wackernagel M, Yount D. The ecological footprint: an indicator of progress toward regional sustainability [J]. Environmental Monitoring Assessment, 1998, 51: 511-529.
-
Bagliani M, Galli A, Niccolucci V, Marchettini N. Ecological Footprint analysis applied to a sub-national area, the case of the province of Siena (Italy) [J]. Journal of Environmental Management, 2008, 86: 354-364.
-
Bicknell K., Ball R J, Cullen R, Bigsby H. New methodology for the ecological footprint with an application to the New Zealand economy [J]. Ecological Economics, 1998, 27: 149-160.
-
Brown M T, Ulgiati S. Emergy measures of carrying capacity to evaluate economic investments [J]. Population Environment, 2001,22: 472-501.
-
Kitzes J, Galli A, Bagliani M, Barrett J. A research agenda for improving national Ecological Footprint accounts [J]. Ecological Economics, 2009, 68: 1991-2007.
-
WWF.2016. Living Planet Report 2016 [R]. World Wildlife Fund for Nature. Gland, Switzerland.
-
Van der Werf H M G, Tzilivakis J, Lewis K, Basset-Mens C. Environmental impacts of farm scenarios according to five assessment methods [J]. Agriculture Ecosystems Environment, 2007, 118(1): 327-338.
-
Blasi E, Passeri N, Franco S, Galli A. An ecological footprint approach to environmental–economic evaluation of farm results [J]. Agricultural Systems, 2016, 145: 76-82.
-
Cuadra M, Björklund J. Assessment of economic and ecological carrying capacity of agricultural crops in Nicaragua [J]. Ecological Indicators, 2007, 7(1): 133-149.
-
Mózner Z, Tabi A, Csutora M. In the quest for the sustainable agricultural yield-comparing the environmental impacts of intensive and extensive agricultural practices [J]. Ecological Indicators, 2012, 16: 58-66.
-
Passeri N, Borucke M, Blasi E, Francoc S, Lazarusb E. The influence of farming technique on cropland: A new approach for the Ecological Footprint [J]. Ecological Indicators, 2013, 29(6): 1-5.
-
Galli A. On the rationale and policy usefulness of Ecological Footprint Accounting: the case of Morocco [J]. Environmental Science Policy, 2015, 48: 210-224.
-
Ferng J. Local sustainable yield and embodied resources in ecological footprint analysis-a case study on the required paddy field in Taiwan [J]. Ecological Economics, 2005, 53: 415-430.
-
Fiala N. Measuring sustainability: why the ecological footprint is bad economics and bad environmental science [J]. Ecological Economics, 2008, 67: 519-525.
-
Galli A, Wiedmann T, Ercin E, Knoblauch D,Ewing B,Giljum S. Integrating ecological, carbon and water footprint into a "footprint family" of indicators: definition and role in tracking human pressure on the plant [J]. Ecological Indicators, 2012,16: 100-112.
-
Zhou T, Wang Y P, Gong J Z, Wang F, Feng Y F. Ecological footprint model modification and method improvement [J]. Acta Ecologica Sinica, 2015, 35( 14) : 4592-4603.
-
Cao Shuyan, Xie Gaodi, ChenWenhui, Guo Hong. Ecological footprint of raw and derived agricultural products [J]. Journal of Natural Resources, 2014, 29(8): 1336-1344
-
Chen GQ, Jiang MM, Chen B, Yang ZF, Lin C. Emergy analysis of Chinese agriculture [J]. Agriculture Ecosystems & Environment, 2006, 115: 161-173.
-
Chen Dongdong. Ecological cost evaluation on agroecosystem based on ecological footprint analysis: methods and cases studies [D]. China Agricultural University, 2008.
-
Zhao Sheng, Li Zizhen, Li Wenlong. A modified method of ecological footprint calculation and its application [J]. Ecological Modelling, 2005, 185(1): 65-75.
-
Huang Jing, Zhang Hailing, Tong Wei, Chen Fu. The impact of local crops consumption on the water resources in Beijing [J]. Journal of Cleaner Production, 2012.21 (1): 45-50.
-
Zhao X, Chen B, Yang Z F. National water footprint in an input-output framework - a case study of China 2002 [J]. Ecological Modelling, 2009, 220(2): 245-253.
-
Cheng Kun, Pan Genxing, Smith Peter, Luo Ting. Carbon footprint of China's crop production—An estimation using agro-statistics data over 1993–2007 [J]. Agriculture Ecosystems & Environment, 2011, 142(3–4): 231-237.
-
Xu Xiaoming, Zhang Bo, Liu Yong, Xue Yanni. Carbon footprints of rice production in five typical rice districts in China [J]. Acta Ecologica Sinica, 2013, 33(4): 227-232.
-
Zhou Xiaoyan, Zhan Wenyan, YE Xinyue, Gan Tian, Han Xiang. Bibliometric analysis of ecological footprint research during 1992-2012 [J]. Porgress in Geography, 2014, 33(3): 333-346 (in Chinese).
-
Sun Yanzhi, Shen Lei. Bibliometric analysis on research progress of four footprint methodologies in China [J]. Jounrnal of Natural Rseource, 2016, 31(9):1463-1473 (in Chinese).
-
Ecological footprints Network. [EB/OL].
http://www.footprintnetwork.org/our-work/ecological-footprint/
-
Monfreda C, Wackernagel M, Deumling D. Establishing national natural capital accounts based on detailed Ecological Footprint and biological capacity assessments [J]. Land Use Policy, 2004, 21(3): 231-246.
-
Ju X, Xing G, Chen X, Zhang S, Zhang, L. Reducing environmental risk by improving N management in intensive Chinese agricultural systems [J]. Proc. Natl. Acad. Sci. USA. 2009, 106: 3041-3046.
-
David Norse, Ju Xiaotang. Environmental costs of China’s food security [J]. Agriculture, Ecosystems Environment, 2015, 209: 5-14.
-
Duan Qiling. Regional difference of ecological footprints of cropland in Jiangsu Province based on emergy analysis [J]. Porgress in Geography, 2008, 27(4): 96-102 (in Chinese).
-
Li J, Liu Z, He C, Tu W, Sun Z. Are the drylands in northern china sustainable? a perspective from ecological footprint dynamics from 1990 to 2010 [J]. Science of the Total Environment, 2016, 553: 223-231.
-
Zhao Guishen, Wang Yichao,Tang Xiaowei, et al. Evaluation of sustainability for intensive farmland ecosystem based on emergy ecological footprint [J]. Transactions of the Chinese Society of Agricultural Engineering, 2014, 30(18): 159-167.
-
Chen Xinping, Cui Zhenling, Fan Mingsheng, et al. Producing more grain with lower environmental costs [J]. Nature, 2014, 514: 486-489
-
Su B W, Heshmati A, Geng Y, Yu X M. A review of the circular economy in China: moving from rhetoric to implementation [J]. Journal of Cleaner Production, 2013, 42(3): 215-227.
-
Chen Lihong, Cong Ronggang, Shu Bangrong, Mi Zhfu. A sustainable biogas model in China: The case study of Beijing Deqingyuan biogas project [J]. Renewable Sustainable Energy Reviews, 2017, 78: 773-779.
-
Xi YG, Pei Q. Emergy evaluation of organic rice-duck mutualism system [J]. Ecological Engineering, 2009, 35 (11): 1677-1683.
-
Chen Shaoqing, Chen Bin. Sustainability and future alternatives of biogas-linked agrosystem (BLAS) in China: an emergy synthesis [J]. Renewable and Sustainable Energy Reviews, 2012, 16: 3948-3959.
-
Liu Z, Wang D, Ning T, Zhang S, Yang Y, He Z. Sustainability assessment of straw utilization circulation modes based on the emergetic ecological footprint [J]. Ecological Indicators, 2017, 75: 1-7.
-
Butler S J, Vickery J A, Norris K. Farmland biodiversity and the footprint of agriculture [J]. Science, 2007, 315: 381-384.
-
Zhu Youyong, Chen Hairu, Fan Jinghua et al. Genetic diversity and disease control in rice [J]. Nature, 2000, 406: 718-722.
-
Li L, Sun J H, Zhang F S, et al. Wheat/maize or wheat/soybean strip intercropping: I. Yield advantage and interspecific interactions on nutrients [J]. Field Crops Research,2001, 71(2): 123–137
-
Li L, Li S M, Sun J H, et al. Diversity enhances agricultural productivity via rhizosphere phosphorus facilitation on phosphorus-deficient soils [J]. Proceedings of the National Academy of Sciences of the United States of America, 2007, 104(27): 11192–11196.
-
Stefano Benvenuti, Francesca Bretzel. Agro-biodiversity restoration using wildflowers: what is the appropriate weed management for their long-term sustainability? [J]. Ecological Engineering, 2017, 102: 519-526.
-
Ferng J J. Measuring and locating footprints: a case study of Taiwan's rice and wheat consumption footprint [J]. Ecological Economics, 2011, 71(1): 191-201.
-
Kissinger M, Dan G. From global to place oriented hectares-the case of Israel's wheat ecological footprint and its implications for sustainable resource supply [J]. Ecological Indicators, 2012, 16: 51-57.
-
Meidad Kissinger, Approaches for calculating a nation’s food ecological footprint—The case of Canada [J]. Ecological Indicators, 2013, 24: 366-374.
-
Zhang Shuang, Li Zhoukui. The ecological footprint analysis of Beijing based on resource consumption [J]. Research of Soil and Water Conservation, 2014, 21(1): 294-298 (in Chinese).
Figures
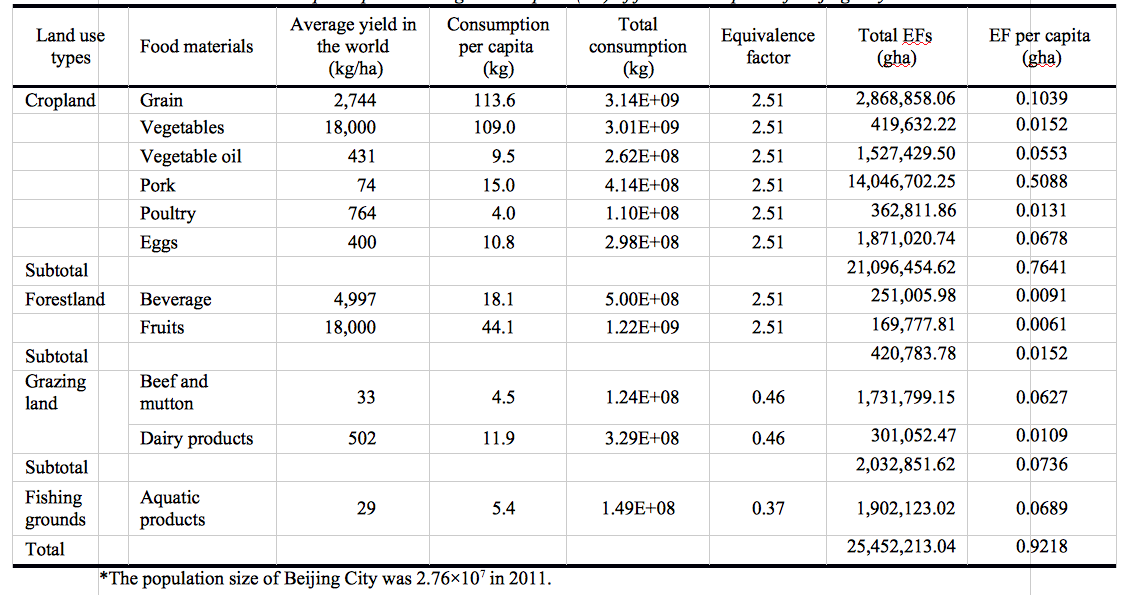
Table1 Total and per capita’s Ecological Footprint (EF) of food consumption of Beijing City in 2011
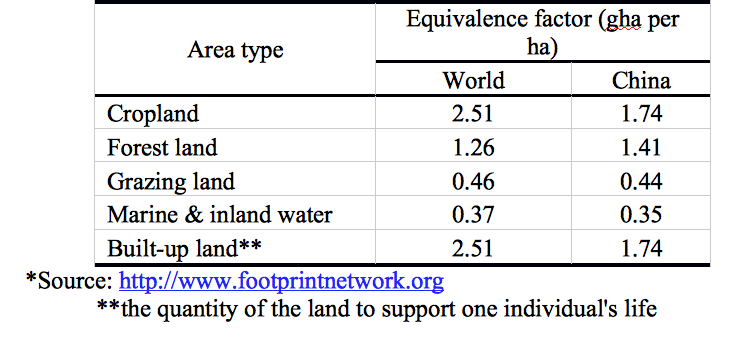
Table 2 Equivalence factor in the World and China in 2010*p
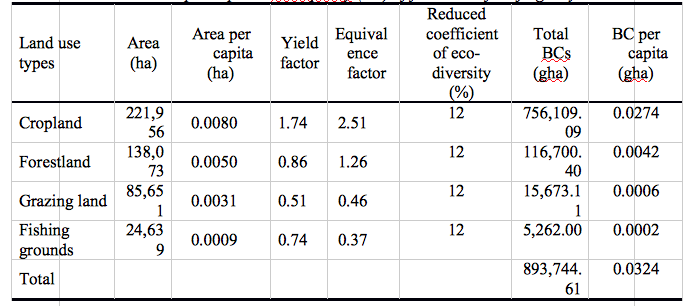
Table 3 Total and per capita’s Biocapacity (BC) of farmland of Beijing City in 2011
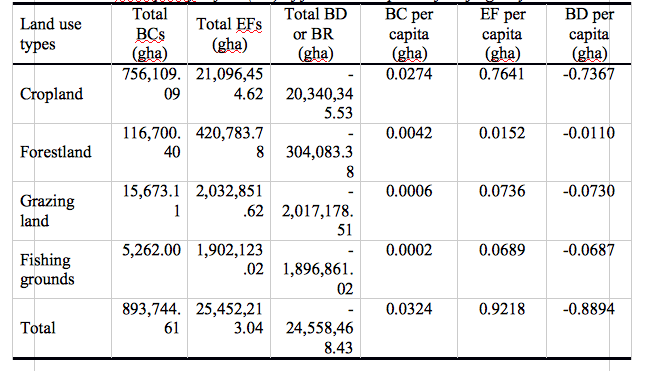
Table 4 Biocapacity deficit (BD) of food consumption of Beijing City in 2011
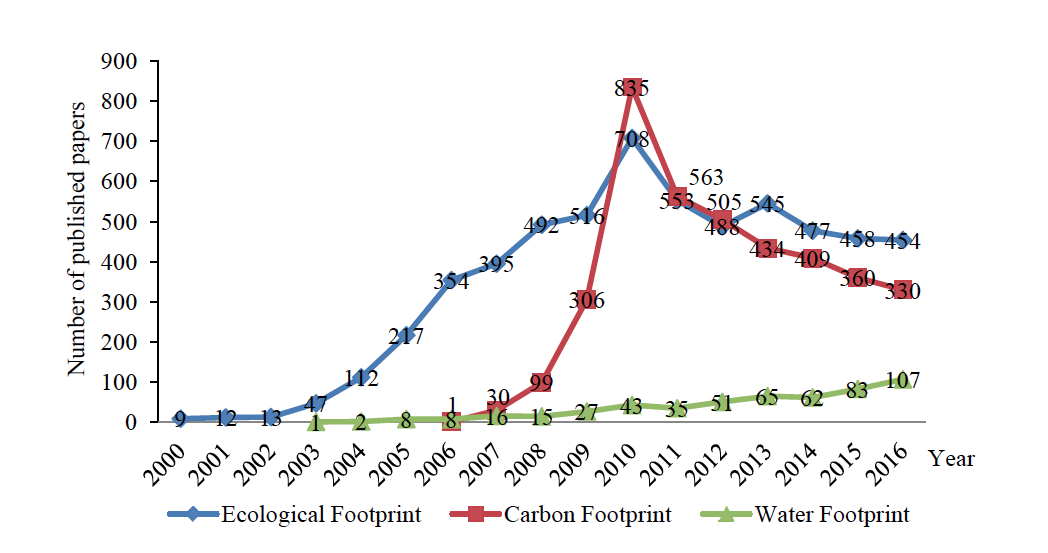
Figure 1 The number of published papers per year on footprint from 2000 to 2016 in CNKI
(China National Knowledge Infrastructure)