
Climate change and the Curate’s Egg; The carbon budget, cycle and sinks.

Keywords: Climate change, carbon sinks, GHG, food production.
See Appendix for definitions of terms used.
Matt Ridley, writing in the Wall Street Journal (1), made a number of points justifying why the world should continue to burn fossil fuels at an increasing rate.
We contend he draws the wrong conclusions from the established evidence. Ridley fails to recognize the potential chronic, dire and irreversible consequences of burning fossil fuels at an ever increasing rate.
Certainly, we agree with Ridley, that fossil fuels are the cheapest source of energy. However, are all the likely costs, now and in the future, of a rising atmospheric CO2 concentration accounted in the ledger? Is rising atmospheric CO2e causing global warming and is this likely to be a continuous event, unless action is taken?
Would a reduction in the rate of burning fossil fuels, with an eventual cessation, gradually halt this rise? If not, life on this earth, as we know it, would seem difficult to sustain. We contend the risks attached to inaction are unacceptable.
The purpose of this editorial is to assess whether Ridley’s article is misleading. His contention is that when there is no dramatic change in climate, or in the frequency of adverse environmental events, as climate fluctuates over relatively short periods of time, we should continue with ‘business as usual’.
However, large short term variation in climate and in the frequency of adverse environmental events, may conceal a slow, but continuous trend in these factors.
Our contention is that if this trend is not stemmed it may reach unbearable limits in some regions of the world. We present below a critique of Ridley’s primary points:
“The one most often invoked today is that we are wrecking the planet’s climate. But are we?” (Ridley,2015).
When solar energy is used for conversion to electrical energy there should be as little fossil fuel energy used as is possible. The construction of wind farms and of solar panels and their replacement, owing to wear and tear, uses energy.
More significantly, both sources provide a discontinuous and unpredictable supply. This means they have to be supported by an assured source. This source, if for example it is a coal fired power station, cannot be turned off when it is not needed.
Moreover, the solar and wind sources ideally require a means of storing excess production, when they may produce more than is needed at any particular time.
Thus, we agree that the adoption of wind farms and solar panels, at least in their present form, in high northern latitudes is not a solution. Their cost may inhibit adequate expenditure on research to determine feasible and effective alternatives.
However, we are interested to note the recent rapid decline in costs of “solar energy” and that research bodies, such as the Rockefeller Foundation and the University of Cambridge are concentrating work in this area of research (http://www.bbc.co.uk/news/world-us-canada-29310475, accessed April 29 2015).
“Most climate scientists remain reluctant to abandon the models and take the view that the current “hiatus” has merely delayed rapid warming. A turning point to dangerously rapid warming could be around the corner, even though it should have shown up by now.” (Ridley, 2015).
If land surface temperature is increasing with time, more slowly than some expected, there are two moderating factors to consider: (a) buffering by the deep ocean: the ocean’s upper layers, have a gigantic heat capacity, so are able to mop up solar heat (conceded by Ridley, 2015 “---the IPCC, have concluded that climate sensitivity is low because ---------ocean-heat uptake”).
There has been an increase in temperature of the top 700 m of the sea of 0.168oC since 1969 (2). Partly as a consequence of this and in part as a consequence of melting snow and ice on land (a process which also absorbs heat), the sea level rose by 1.7 cm per decade during the 20th century and has increased over 3.6 cm over a decade since 1993 (3).
“There has been ------- no acceleration of sea-level rise” (Ridley 2015). (b) Second, the failure for a large increase during the earlier years of this century is apparently not due to a failure of an effect of GHGs, but the 2000s witnessed a periodic solar output decline resulting in an unusually deep solar minimum in 2007-2009 (4).
The Greenland and Antarctic ice sheets have decreased in mass. Data from NASA's Gravity Recovery and Climate Experiment show Greenland lost 150 to 250 km3 (36 to 60 cubic miles) of ice per year between 2002 and 2006, while Antarctica lost about 152 km3 (36 cubic miles) of ice between 2002 and 2005 (5).
This process absorbs heat and also the exposed land and sea surface reflects less back to space. The melting would account in a large part for the acceleration in sea level rise (3).
If these conclusions are correct, they would explain the failure of the Earth’s surface to warm nearly as fast as predicted over the past 35 years, “despite carbon-dioxide levels rising faster than expected” (Ridley, 2015).
The amount of carbon dioxide absorbed by the upper layer of the oceans is increasing by about 2 thousand million tonnes per year (2Gt/yr) and since the beginning of the Industrial Revolution it has led to an increase in the acidification of the top layers of the oceans by 30% (6 ; 7; 8, 9, www.pmel.noaa.gov).
The rise in atmospheric CO2 has two major effects on ocean biology: (a) warming lowers the ocean’s oxygen tension and (b) acting as a carbon sink, it leads to its acidification.
A discussion of the consequences of this are not part of this editorial, but they are a source of alarm to oceanographers and influence oceans as a source of food (10).
“Only in the 1970s and 1980s did scientists begin to say that the mild warming expected as a direct result of burning fossil fuels—roughly a degree Celsius per doubling of carbon-dioxide concentrations in the atmosphere—might be greatly amplified by water vapor and result in dangerous warming of two to four degrees a century or more. That “feedback” assumption of high “sensitivity” remains in virtually all of the mathematical models used to this day by the U.N. Intergovernmental Panel on Climate Change, or IPCC” (Ridley, 2015).
Climate models are based on fundamental natural processes. They are in a constant state of testing by thousands of scientists in universities, research centres and operational weather and climate centres around the globe.
The tests involve observations and model improvement, compared in many different ways. The trend is towards increased fidelity in representing atmospheric and climatic processes.
This is not surprising - the models contain fundamental physical, chemical and biological relationships that have been known for many years. The very notion of “abandoning” the models implies a fundamental flaw has been found. It hasn’t.
Land and ocean mean surface air temperature continues to increase (11,), as shown by NASA data (4) (Fig. 1) taken from all three major global (land & ocean) surface temperature reconstructions show that Earth has warmed since 1880 (12, www.ncdc. noaa.gov/oa/) in both the northern and southern hemispheres.
Most of this warming has occurred since the 1970s in the north, with the 20 warmest years occurring since 1981, of which 10 of the warmest were during the period 1996-2008 (13).
Global carbon emissions are increasing with time. Le Quéré1et al. (14), reported that for the last decade available (2002–2011), CO2 emissions from fossil fuel combustion and cement production were 8.3 ± 0.4 GtC yr-1, and that they will increase to 9.9 ± 0.5 GtC in 2013, 3.0 per cent above 2010 and 61% above emissions in 1990, based on projections of world gross domestic product and recent changes in the carbon intensity of the economy.
Emissions from land cover change, deforestation and fire activity in regions undergoing deforestation were 1.0 ± 0.5 GtC yr-1.
Thus, for the period, 1870–2013, about 70% of carbon emissions have come from burning fossil fuels and cement production and 30% from land cover change.
”There has been no increase in the frequency or severity of storms or droughts, ----- the extra carbon dioxide in the air has contributed to an improvement in crop yields and a roughly 14% increase in the amount of all types of green vegetation on the planet since 1980.”(Ridley, 2015)
Today we publish two papers from China which describe the effects, both potential and measured, of climate change on crop production in China. Aiqin, Ming and Xiuju (pp 43-49) report crop yields between 1980 and 2010.
Despite a northward expansion in cultivatable land area in China, owing to climate warming, and an increased fertilization effect of CO2, the resulting net crop yield loss in China, owing to the warming, change in pattern of precipitation and increased frequency and intensity of extreme weather, is estimated to be 5%-10% in the next 30 years, based on their evidence.
“----despite carbon-dioxide levels rising faster than expected—the warming rate has never reached even two-tenths of a degree per decade---“ (Ridley 2015).
Over the past forty years the six Chinese regions have all been subject to a rise in surface temperature leading to a mean decadal change of +0.26oC, with a loss of sunshine and with an increase in the incidence of extreme weather; but precipitation has declined in the north and increased in the south.
The average decadal values (Aiqin, Ming and Xiuju, pp 43-49) are:
temperature (C) mean land surface +0.26o, range+ 0.18o to +0.38o
Precipitation (mm) -9.3 in the Northern regions, + 11.7 in the Southern regions
Sunshine, (h) mean -58.5, range -24 to -119
Moreover, Ding Yihui et al. (2006) (15) measured China's warming trend over the last 50 years, during which the land surface air temperature has increased 1.1oC, i.e. 0.22oC per decade.
Thus, the values from the present report are for an increase of +0.26oC per decade over the last 30 years and a value of +0.22oC per decade over the past 50 years – these values are within the same error range – both exceeding 0.2oC; although the variation is, as expected, considerable.
Over the last 100 years in China the decadal rate has been +0.08oC (16,), indicating a steep acceleration in the rate of over recent decades.
“carbon dioxide in the air has contributed to an improvement in crop yields and a roughly 14% increase -------.Carbon-dioxide emissions should cause warming-------- a shifting northward the climate where cultivation was possible.” (Ridley, 2015)
An analysis of the impacts of climate change on agricultural production in China showed trends of temperature rise, sunshine decline and precipitation fluctuations overall. The frequency and intensity of extreme weather are increasing.
The increased temperature has resulted in the northward and westward expansion of the cropping boundary, thereby increasing the area of arable land by 4.91% of the total in the Northeast from 1981 to 2010; in addition there has been a fertilization effect of CO2 to increase grain yield.
However, the temperature rise and precipitation decline aggravate drought, and water shortage in most parts of the north, thereby lowering the yields of maize, wheat and soybean, which together with an increased frequency and intensity of meteorological disasters in other regions, are expected to lower net crop yield in Chinaby 5%-10% in the next 30 years (Aiqin,Ming & Xiuju, pp 43-49.).
What is causing the increased rate of CO2e production?
The paper by Jiang, Li, Bian , Ming, Qu, Shi, Zhang & He. (pp 19-24) shows that as a result of industrialization an increasing proportion of China’s cultivated land is being urbanized, causing considerable environmental damage.
By modelling the carbon budget resulting from the industrialization and urbanization of farmland from 1996 to 2020, they have shown that the area of China’s cultivated land is decreasing, from 1.293 million km2 in 1996 to a predicted 1.204 million km2 in 2020, whereas 0.499 million km2 were likely to be built on by 2020 rising from 0.204 million km2 in 1996.
As a direct consequence the national carbon sink is likely to have decreased from 0.79 billion tonnes/an. in 1996 to 0.748 billion tonnes/an. in 2020, and GHG production is likely to have increased from 9.34 billion tonnes/an. in 1996 to 11.7 billion tonnes/an. by 2020.
A similar situation is occurring in most regions of the world- that is urbanisation of the natural environment is likely to be causing a loss of carbon sinks and an increase in GHG production at the approximate rates respectively of 0.20 and 14.76 tonnes/ha annually, where industrial and urban building is replacing the natural environment.
In addition there will be an increasing loss of both animal and plant species (biodiversity).
These developments are the result of an increasing world population and a general movement of people from the countryside to cities with greater social demands and increased consumption per capita with their increased rates of consumption of fossil fuels.
Conclusions
The sensible conclusion is that the risks of an ever increasing atmospheric concentration of CO2 are too great to be accepted or even to be contemplated.
Even without absolute proof that rising atmospheric concentrations of GHGs are the cause of climate change and that this change is largely anthropogenic it seems very sensible to curb the use of fossil fuels, as soon as possible, otherwise the rise in atmospheric CO2e and temperature may reach limits which make normal human activity impossible.
Slowing the rate does not mean the immediate cessation of the burning of fossil fuels, because research and development of alternatives have to be financed.
The solutions require more serious international cooperation than occurs at present.
The rise in surface temperature and the decline in biodiversity are not only correlated with, but are very likely to have, an anthropogenic origin, i.e. there will be too many of us on this planet! It seems wise to voluntarily curb the growth of the human species.
It might otherwise be subject to a cataclysmic decline at some undeterminable future date, as occurs with most other species which outgrow their position on this planet.
F Footnote: This term derives from a cartoon published in the British magazine Punch on 9 November 1895. Drawn by George du Maurier and entitled True Humility, it pictures a timid-looking curate eating breakfast in his bishop's palace.
The bishop remarks with candid honesty to his lowly guest: "I'm afraid you've got a bad egg, Mr Jones." The curate replies, desperate not to offend his eminent host and ultimate employer: "Oh, no, my Lord, I assure you that parts of it are excellent!"
Appendix
Carbon Unit Equivalents
UK Legislation (Climate Change Act 2008 ) refers to carbon budgets in terms of carbon unit equivalents, i.e. including all major greenhouse gases- carbon dioxide (CO2), methane (CH4), nitrous oxide (N2O), hydrofluorocarbons (HFCs), perfluorocarbons (PFCs), sulphur hexafluoride (SF6) and any other greenhouse gas added later.
Carbon dioxide equivalency is a quantity that describes, for a given mixture and amount of greenhouse gas, the amount of CO2 that would have the same global warming potential (GWP), when measured over a specified timescale (generally, 100 years), described as CO2e. For example, the GWP for methane is 25 and for nitrous oxide 298.
This means that emissions of 1 million metric tonnes of methane and nitrous oxide, respectively, are equivalent to emissions of 25 and 298 million metric tonnes of carbon dioxide i.e. CO2em. Many documents use CO2ev.
This refers to an equivalent volume of gas which is similar for N20, but quite different for methane and for sulphur hexafluoride – for one volume of methane the equivalent volume of CO2, is not 25 but only 9.1.
The carbon cycle is the series of processes by which carbon compounds are interconverted between its major reservoirs—the atmosphere, oceans, and living organisms, involving the incorporation of carbon dioxide into living tissue by photosynthesis and its return to the atmosphere through respiration, the decay of dead organisms, and the burning of fossil fuels.
A carbon sink is a natural, or artificial, reservoir that accumulates and stores some carbon-containing chemical compound for an indefinite period. The process by which a carbon sink removes carbon dioxide (CO2) from the atmosphere to a carbon sink is known as carbon sequestration.
Forests, soils, oceans and the atmosphere all store carbon and this carbon moves between them in a continuous cycle.
Presently the greatest sinks are areas of vegetation, especially forests, and the phytoplankton-rich sea – these absorb the carbon dioxide produced by the burning of fossil fuels.
The global carbon budget is the balance of the exchanges (incomes and losses) of carbon between the carbon reservoirs, or between one specific loop (e.g., biosphere and atmosphere) of the carbon cycle.
Fixation is a process of incorporating carbon dioxide into the molecules of living matter. Nearly all carbon dioxide fixation is accomplished by means of photosynthesis.
Photosynthesis is the process in which green plants, algae, and cyanobacteria utilize the energy of sunlight to manufacture carbohydrates from carbon dioxide and water in the presence of chlorophyll.
References
1 Matt Ridley, Wall Street Journal, March 13,( 2015) Fossil Fuels Will Save the World (Really).
2, S. Levitus,1 J. I. Antonov,1 T. P. Boyer,1 R. A. Locarnini,1 H. E. Garcia,1
and A. V. Mishonov1 (2009) Global ocean heat content 1955–2008 in light of recently revealed instrumentation problems. GEOPHYSICAL RESEARCH LETTERS, VOL. 36, L07608, doi:10.1029/2008GL037155
3, Church, J. A. and N.J. White (2006), A 20th century acceleration in global sea level rise, Geophysical Research Letters, 33, L01602, doi:10.1029/2005GL024826. The global sea level estimate described in this work can be downloaded from the CSIRO website. (Understanding global sea levels: past, present and future. John A. Church, Neil J. White, Thorkild Aarup, W. Stanley Wilson, Philip L. Woodworth, Catia M. Domingues, John R. Hunter and Kurt Lambeck)
4. Gavin A. Schmidt (2015) Website Curator: Robert B. Schmunk, pp. 1-2, page update 17/04/15 NASA, Goddard Institute for Space Studies
5, L. Polyak, et.al., “History of Sea Ice in the Arctic,” in Past Climate Variability and Change in the Arctic and at High Latitudes, U.S. Geological Survey, Climate Change Science Program Synthesis and Assessment Product 1.2, January 2009, chapter 7.
6 , Christopher L. Sabine, Richard A. Feely, Nicolas Gruber, Robert M. Key, Kitack Lee, John L. Bullister, Rik Wanninkhof, C. S. Wong, Douglas W. R. Wallace, Bronte Tilbrook, Frank J. Millero, Tsung-Hung Peng, Alexander Kozyr, Tsueno Ono, Aida F. Rios (2004) The Oceanic Sink for Anthropogenic CO2. Science, 305(5682), 367–371
7, Allison, I., Bindoff, N. L., Bindschadler, R. A., Cox, P. M., de Noblet, N., England, M. H., Francis, J. E., Gruber, N., Haywood, A. M., Karoly, D. J., Kaser, G., Le Quere, C., Lenton, T. M., Mann, M. E., McNeil, B. I., Pitman, A. J., Rahmstorf, S., Rignot, E., Schellnhuber, H. J., Schneider, S. H., Sherwood, S. C., Somerville, R. C. J., Steffen, K., Steig, E. J., Visbeck, Martin and Weaver, A. J. (2011) The Copenhagen Diagnosis: Updating the World on the Latest Climate Science. Elsevier, Oxford, UK, 114 pp. 2. ISBN 9780123869999. page 36.
8, Neyssa Hays (2014) Demystifying Ocean Acidification: a Human Interest Story ag Archives: ocean acidification, Posted on January 23, 2014 2; http://www.pmel.noaa.gov/co2/story/What+is+Ocean+Acidification%3F9, Anon. (2015) ARGUMENTATIVE, DIVISION/CLASSIFICATION pp. 3-10 IS GLOBAL CLIMATE CHANGE REAL?
9, 13.http://www.pmel.noaa.gov/co2/story/Ocean+Acidification
10, Brander, K.M. (2007) Global fish production and climate change, Proceedings of the National Academy of Science of the United States of America, 104 (50) December 11, 19709–19714, doi: 10.1073/pnas.0702059104.
11 , I. Allison, N.L. Bindoff, R.A. Bindschadler, P.M. Cox, N. de Noblet, M.H. England, J.E. Francis, N.Gruber, A.M. Haywood, D.J. Karoly, G. Kaser, C. Le Quéré, T.M. Lenton, M.E. Mann, B.I. McNeil, A.J. Pitman, S. Rahmstorf, E. Rignot, H.J. Schellnhuber, S.H. Schneider, S.C. Sherwood, R.C.J. Somerville, K. Steffen, E.J. Steig, M. Visbeck, A.J. Weaver. (2009). The Copenhagen Diagnosis: Updating the World on the Latest Climate Science, The University of New South Wales. Climate Change Research Center, Sydney, Australia. 60pp, p.11.
12, Richard W. Reynolds and Huai-Min Zhang (2009) In Situ and Satellite Sea Surface Temperature (SST) Analyses. pp.1-5. NOAA National Climatic Data Center, Asheville NC FY2009 Annual Report [In Situ and Satellite SST Analyses] http://www.ncdc.noaa.gov/oa/climate/research/ anomalies/index.html
http://www.cru.uea.ac.uk/cru/data/temperature; http://data.giss.nasa.gov/gistemp
13, T.C. Peterson et.al., (2009) “State of the Climate in 2008,”Special Supplement to the Bulletin of the American Meteorological Society, v. 90, no. 8, August 2009, pp. S17-S18.
14, C. Le Quéré1, G. P. Peters2, R. J. Andres3, R. M. Andrew2, T. A. Boden3, P. Ciais4, P. Friedlingstein5, R. A. Houghton6, G. Marland7, R. Moriarty1, S. Sitch8, P. Tans9 et al. (2014). Global carbon budget 2013; Earth System Science Data, 6, 235-263.
15, Ding Yihui, Ren Guoyu, Shi Guangyu, et al. (2006) National assessment report of climate change (I): Climate change in China and its future trend. Advances in Climate Change Research 2(1):3-8.
16, Guoli Tang, Yihui Ding, Shaowu Wang Guoyu Ren,Hongbin Liu Li Zhang (2010) Comparative Analysis of China Surface Air Temperature Series for the Past 100 Years. ADVANCES IN CLIMATE CHANGE RESEARCH 1(1): 11-19. www.climatechange.cn DOI: 10.3724/SP.J.1248.2010.00011 Corresponding author: Guoli Tang, tanggl@cma.gov.cn
Download pdf
Figures
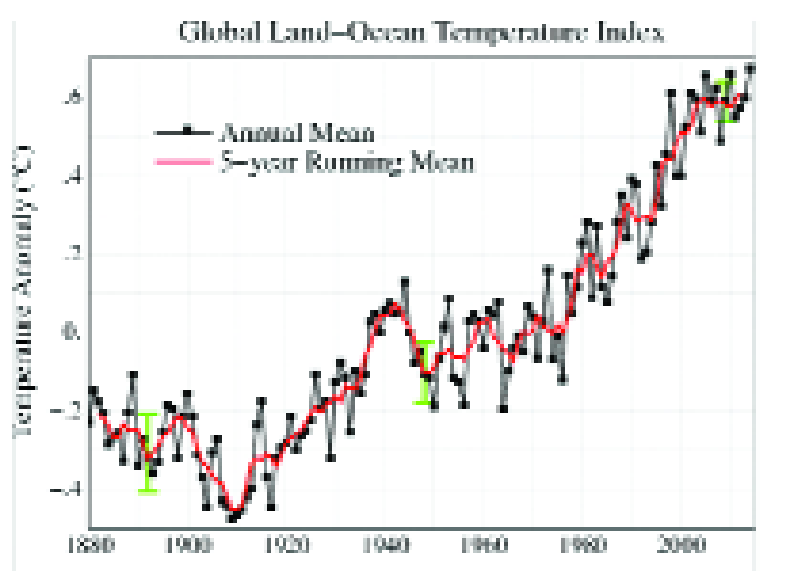
Fig. 1, Global Annual land and ocean mean Surface Air Temperature, (NASA, 2015)