
A review of changes in the use of raw materials in the manufacture of animal feeds in Great Britain from 1976 to 2011
Summary
The use of raw materials for the manufacture of compounded and blended animal feeds reflects their supply and relative cost to meet nutritional specifications.
Trends in the use of raw materials in the production of animal feeds in Great Britain between 1976 and 2011 were studied using national statistics obtained through monthly surveys of animal feed mills and integrated poultry units to test the hypothesis that animal feed industries are capable potentially of adapting to future needs such as reducing their carbon footprints (CFP) or the use of potentially human edible raw materials.
Although total usage of raw materials showed relatively little change, averaging 11.3 million tonnes (Mt) per annum over the 35-year period, there were substantial changes in the use of individual raw materials.
There was a decrease in total cereal grain use from 5.7 Mt in 1976 to 3.5 Mt in 1989, with a subsequent increase to 5.4 Mt in 2011.
The use of barley grain declined from 1.9 Mt in 1976 to 0.8 Mt in 2011, whilst the use of maize grain also decreased from 1.5 Mt in 1976 to 0.11 Mt in 2011.
There were substantial increases in the use of wheat grain, from 2.1 Mt in 1976 to 4.4 Mt in 2011, and oilseed products, from 1.2 Mt in 1976 to 3.0 Mt in 2011.
The use of animal and fish by-products decreased from 0.45 Mt in 1976 to 0.11 Mt in 2011 with most of the decrease following the prohibition of their use for ruminant feeds in 1988.
There was relatively little change in the proportion of potentially human-edible (mainly cereal grains and soyabean meal) raw material use in animal feeds, which averaged 0.53 over the period.
The trend in the total annual CFP of raw material use was similar to the trend in the total quantities of raw materials used over the period.
Mean CFP t-1 was 0.57t CO2e t-1 over the period (range 0.53 to 0.60). CFP t-1 remained relatively stable between 1995 and 2011, reflecting little change in the balance of raw material use.
The decreased use of cereal grains from 1976 to 1989 suggests that animal feed industries can adapt to changes in crop production and also can respond to changes in the availability of co-product feeds.
With a rising world human population, demand for human-edible feeds such as cereal grains will increase and will most likely make their use less attractive in diets for livestock.
In the short-term specific economic incentives may be required to achieve significant reductions in human-edible feed use by livestock or in the CFP t-1 of animal feeds.
Keywords: Raw materials, trends, human-edible, carbon footprint.
Abbreviations
CFP carbon footprint; CO2e carbon dioxide equivalent; CP crude protein; DEFRA Department for Environment, Food and Rural Affairs; DDGS distillers’ dried grains with solubles; GB Great Britain; GWP global warming potential; IPU integrated poultry unit; Mt million tonnes.
Glossary
Carbon footprint: Emissions of greenhouse gases (GHG), carbon dioxide (CO2), methane (CH4) and nitrous oxide (N2O), expressed as Global Warming Potential (GWP) in carbon dioxide equivalents (CO2e) on a 100-year time scale where CO2 = 1, CH4 = 23 and N2O = 300.
Raw materials: Crop products, co- products, animal and fish by-products, minerals and vitamins. Also known as “straights”.
Compounds: Mixtures of raw materials which have been ground (normally hammer-milled) and pelleted by extrusion through a die- press.
Blends: Mixtures of raw materials, not ground or pelleted. Grains and seeds are usually crushed but not ground.
Introduction
The composition of compounded and blended feeds manufactured by animal feed mills reflects the supply and relative cost of different raw materials.
Worldwide, waste products from the manufacture of human foods and other products have been major sources of raw materials for animal feeds for many decades.
For example, the importation into Europe of cereal grains and oilseeds in the latter part of the nineteenth century for the production of bread and soap led to the development of animal feed mills close to shipping ports as a way of dealing with waste products from the primary production processes and at the same time adding value to the basic raw materials (1).
Although the main emphasis was on converting co-products which would otherwise be wasted into milk and meat, some potentially human-edible cereal grains, cereal co-products, pulses and oilseeds were also used to meet nutrient specifications, normally on a least-cost basis with specific constraints.
Compounded (i.e. milled, mixed and pelleted) and blended (i.e. mixed but not milled or pelleted) animal feeds were formulated historically to be nutritionally-balanced complete feeds for monogastric livestock and, for ruminants, to be relatively high in crude protein (CP) to complement the relatively low CP concentration of pasture conserved as hay for winter feeding.
The main objective has continued to be the application of established nutritional principles to meet the requirements of animals for essential nutrients and to increase livestock productivity.
Animal feed industries have made major contributions in all countries to reducing waste and environmental pollution through the utilisation in diets for livestock of human-inedible co-products, mainly from the human food and drink industries.
The environmental impact of livestock production includes emissions of the so-called “greenhouse” gases, principally carbon dioxide, methane and nitrous oxide, produced during the manufacture and use of inputs to the system (e.g. feed, fertiliser, housing, equipment).
In addition, emissions of methane are produced from enteric digestion in animals and emissions of methane and nitrous oxide arise from their manure.
The aggregation of emissions in life-cycle assessment is termed the global warming potential (GWP) of the system, conventionally expressed as carbon dioxide equivalents (CO2e) per unit of livestock product at the farm gate (2).
The relative GWP of a range of typical European and North American crop production systems and of typical European livestock systems were studied by Wilkinson and Audsley (3).
They found that an option to reduce the GWP of milk and meat production was to improve the efficiency of conversion of feed into animal product.
However, they did not examine the GWP of different raw materials and the effect of changing raw material resource use on the GWP of concentrate feeds.
Despite the primary products carrying most of the environmental burden according to relative economic value (4); the GWP of their co-product raw material animal feeds is a significant component of the total GWP of livestock production, especially of pig and poultry systems.
Concentrates are also a major economic cost of production in milk, pig meat and poultry systems, accounting for most of the variable costs of production (Table 1).
The relatively low percentage of total GWP accounted for by concentrates in ruminant systems reflects the fact that grazed pasture and forage crops comprise the major components of the animal’s diet and that methane from the animal and its manure is a major contributor to total GWP (5).
The relatively high unit cost of ruminant concentrates compared to grazed and conserved forages accounts for their important contribution to the variable costs of milk and beef production.
The proportion of human-edible feed in typical diets for UK livestock ranges from 0.36 for milk production to 0.75 for poultry meat production (6).
Whereas poultry are more efficient, ruminants can use land unsuitable for growing crops for direct human consumption.
Despite large differences in overall feed conversion efficiencies between different livestock systems, the conversion of human-edible feeds into animal products is similar between ruminant and non- ruminant systems of production because of the relatively higher proportion of inedible feeds (grassland and other inedible raw materials) in ruminant diets than in diets for pigs and poultry (6).
World populations of livestock, relative to 1961 have increased over the past 50 years 1.5-fold for ruminant livestock, 2.5-fold for pigs and 4.5-fold for chickens (7).
The trend of an increased global population of non- ruminants is likely to result in greater pressure in future years on the use of human-edible feeds for animals and concern has been expressed already over the consumption by livestock of potentially human-edible raw materials, both in terms of environmental impact (8) and global food supply (9, 10).
A major environmental concern worldwide is the production of soyabeans on land recently converted from rainforest.
The effect of land use change in soyabean production, and of replacing imported oilseed meals such as soyabean meal with locally-sourced pulse grains such as field beans and peas, on the GWP of livestock production systems has been studied in pigs (11) and poultry (12).
Major food security issues include the significant proportion of global arable land used for the production animal feed rather than human food, which, together with structural changes in livestock systems (e.g. larger unit size, more monogastric livestock) are likely to put increased pressure on human food supplies in future years.
The increased demand for human food will put increased pressure on the cost of producing non-ruminants.
This will lead to a new market equilibrium in which higher meat prices lead to lower levels of demand. The balance will depend upon the income elasticity of demand for cereals and meat, which may be lower for cereals than for meat.
In this paper the use of raw materials for the production of compounds and blends in Great Britain was analysed over the thirty-five year period from 1976 to 2011 with the objective of identifying trends in the composition of animal feeds and, using the example of national statistics from Great Britain, to test the hypothesis that animal feed industries are capable of change in response to future needs such as reducing human-edible feed use and environmental impact. Some implications for the future composition of animal feeds are also considered.
Material and methods
Statistics for the use of raw materials in the production of animal feeds in Great Britain from the monthly survey of animal feed mills were retrieved from the archives of the office of the Department for Environment, Food and Rural Affairs (DEFRA), Foss House, Peasholme Green, York, YO1 7PX, UK (13, 14).
Together with those available online for the period 1996 to 2011 (15) the data were used to derive trends in the use of raw materials for the 35-year period from 1976 to 2011.
To these data were added statistics for the usage of cereal grains from the monthly survey of integrated poultry units (IPU, 16).
The IPU survey, which commenced in 1991, does not include information on the use of protein-rich raw materials such as soyabean meal.
It was assumed that soyabean meal accounted for 0.15 of the total feed produced by IPU from 1991 to 2011 (17, 18).
The monthly surveys, conducted under the 1947 Statistics of Trade Act (19), evolved over the period, particularly with respect to the description of oilseed cakes and meals and “animal substances”.
From 1976 to 1983 oilseed cakes and meals were categorised as being either “high and medium protein” (more than 0.22 crude protein, CP) or “low protein” (less than 0.22 CP). In 1984 whole oilseeds and oilseed rape meal (described here as rapeseed meal) were categorized separately.
In 1991 “soya cake and meal” (described here as soyabean meal) and “sunflower cake and meal” were added to the survey.
The proportion of cereal grains, pulse grains and soyabean meal pre- sumed to be human-edible was 0.8, that of other oilseed meals and other materials 0.2 and that of minerals and premixes zero (6).
A comprehensive project has been undertaken to determine the carbon footprint (CFP) of raw material animal feeds (4) and the results of this work were used to assess trends in the CFP of animal feed manufacturing in Great Britain from 1976 to 2011.
Total annual CFP (Mt) and CFPt-1 were esti- mated from values in the Dutch “Feedprint” Model 2012, Version 18 (4, Table 2) in which emissions, appor- tioned on an economic value basis between primary and co-products, were derived for each raw material for crop production, storage, transportation, processing, land use (i.e. changes in land management) and land use change (e.g. deforestation) allocated on a global basis.
Results
The total annual use of raw materials in the production of compounded and blended feeds by animal feed mills in Great Britain for the period 1976 to 2011 is shown in Figure 1 together with the estimated human-edible pro- portion of raw material use.
There was relatively little change from 1976 to 1989, with about 10 million tonnes of materials being used annually. There was an increase in subsequent years with usage reaching a peak in 1995 at 13.5 million tonnes.
There was then a decrease from 1996 to less than 12 million tonnes in 2000, with relatively little change thereafter.
The human-edible proportion decreased somewhat in the period 1976 to 1990 and increased thereafter, but the changes were relatively small, ranging from 0.49 to 0.55 and averag- ing 0.53 over the whole period.
There were substantial increases in the use of wheat grain, from 2.1 Mt in 1976 to 4.4 Mt in 2011, and oilseed products, from 1.2 Mt in 1976 to 3.0 Mt in 2011, over the whole period.
The use of animal and fish by-products decreased from 0.45 Mt in 1976 to 0.11 Mt in 2011 with most of the decrease following the prohibition of their use for ruminant feeds in 1988.
The annual use of total cereal grains, pulse grains (beans and peas), cereal co-products, oilseed co-products and animal and fish meals in the production of compounded and blended animal feeds in Great Britain between 1976 and 2011 is shown in Figure 2.
The use of cereal grains declined from 5.7 million tonnes in 1976 to 3.5 million tonnes in 1989, increasing there-after to reach almost 6 million tonnes in 1994. Between 1995 and 2011 total cereal grain usage remained between 5.1 and 5.4 million tonnes annum-1.
Total oilseed use, comprising mainly the residual meals and cakes from the extraction of oil from soyabeans, rape-seed, sunflower and palm seeds, increased strongly from 1.2 million tonnes in 1976 to 3.2 million tonnes annum-1 in 1996, decreased somewhat until 2005, then increased to 3.1 mil- lion tonnes annum-1 in the period 2007 to 2011.
Cereal co-products, comprising principally wheatfeed from the production of flour, maize gluten feed from the extraction of starch from maize grain and distillers dried grains with solubles from the production of spirit drinks, showed an increase between 1989 and 1993 and a decrease between 2004 and 2009, remaining relatively stable at other times.
The use of animal and fish meals remained relatively constant at 0.4 million tonnes annum-1 between 1976 and 1989, but declined there-after to 0.1 million tonnes annum-1 in 2011.
The use of animal by-products decreased due to the prohibition of their use in ruminant feeds in 1988 and the prohibition of the use of meat and bone meal for all farmed livestock in 1996 (20).
Compared to cereal grains and oilseeds, the use of beans and peas remained relatively low throughout the period, showing a slight increase from 1988 to a peak of 0.38 million tonnes annum-1 in 1994 and declining thereafter to around 0.1 million tonnes annum-1 between 1996 and 2011.
There was a large increase in the use of wheat grain at the expense of barley and maize grain, from 0.36 of total cereal grains in 1976 to 0.81 of total cereal grains in 2011 (Figure 3).
The use of barley grain decreased, from 1.9 million tonnes in 1976 to 0.8 million tonnes in 2011. The use of maize grain also declined from 1.5 million tonnes in 1976 to 0.11 million tonnes in 2011.
Oats and other cereal grains (e.g. sorghum) were relatively minor raw materials throughout the period.
The use of rapeseed meal, soyabean meal and other oilseed meals is shown in Figure 4. Prior to 1988 the survey did not separate oilseed products by source of raw material but by concen- tration of CP (“high and medium” or “low”, see above).
The quantities of “other” oilseeds used between 1976 and 1987 in Figure 4 were all oilseed products. The use of rapeseed meal increased from 0.3 million tonnes in 1988, when it was first categorised separately in the survey, to 0.7 million tonnes in 2011 – an increase of 132%.
Although soyabean meal was first included as a separate category in the survey in 1991, it is probable that it comprised a significant proportion of “other” oilseeds prior to 1991 since the usage of “other” oilseed products decreased substantially from 1991 onwards (Figure 4).
From 1991 onwards, other oilseeds comprised mainly sunflower, palm kernel, linseed, cotton seed and groundnut meals. Whole oilseeds were used to a very limited extent – between 0.05 and 0.08 million tonnes annum-1.
The pro- portion of soyabean meal in the total oilseed usage was relatively constant between 1991 and 2011 averaging 0.49 (range 0.45 to 0.53).
The quantities of soyabean meal imported into Great Britain are shown in Figure 5 from international trade sta- tistics (21).
The data show a progressive increase in the quantity imported annually, from 1.15 million tonnes in 1988 to 1.91 million tonnes in 2011 – a 66% increase over the period.
The trend in the total CFP of the quantities of raw materials used annu- ally from 1976 to 2011 is shown in Figure 6.
Total raw material CFP remained relatively constant at around 5.5 million tonnes CO2e annum-1 between 1976 and 1990, then increased to reach a peak of 8.1 million tonnes CO2e in 1994.
Thereafter the CFP decreased to 6.4 million tonnes CO2e annum-1 in 2009, with a small increase thereafter. Mean CFP t-1 was 0.57t CO2e t-1 over the period (range 0.53 to 0.60). The CFP t-1 remained rel- atively stable between 1995 and 2011, reflecting little change in balance of raw material use.
Discussion
The trends described in this paper refer only to statistics for the use of raw materials by animal feed mills in the manufacture of compounded and blended feeds to specific formulations in Great Britain.
Raw materials delivered direct to farms are not included in the data presented here because they are not specified by individual raw material source in the data collected in the monthly survey of animal feed mills.
It is likely therefore that there is a bias in the trends due to the increased use of raw materials for the home-mixing of diets on farms in Great Britain (and in other countries) over the period of study, particularly in the last decade, as the size of livestock enterprises increased (22).
For example, it has been estimated that about 0.5 of milk producers in the United Kingdom currently own a mixer-wagon in which raw material feeds and forages are combined to produce total mixed rations (23).
The total quantity of raw materials used annually in the manufacture of feeds by animal feed mills showed relatively little change between 1991 to 2011 (Figure 1) despite major changes in the populations of different livestock sectors in the period.
For example, number of dairy cattle, breeding sheep and breeding pigs in England decreased by 42% (from 2.0 million), 31% (from 9.4 million) and 0.44 (from 0.6 million), respectively, between 1990 and 2010 (24).
In contrast, total poultry slaughterings increased in the United Kingdom by 0.38 over the same period (22).
Further, the annual average output of milk per dairy cow increased by 77% during the period, from 4263 litres per annum in 1976 to 7533 litres per annum in 2011 (22).
The increased annual output of milk per cow was apparently sustained by greater use of concentrates since there was no change in the period 1990 to 2010 in the ratio of milk produced per unit of dairy cow compounded and blended feed (25).
The use of substantial quantities (in excess of 5 million tonnes annually) of raw materials which would otherwise be waste products illustrates the contribution made by the animal feed industry of Great Britain over the past 35 years to the reduction of environmental pollution through the conversion of human-inedible co-products from the human food and drink industries into useful components of the diets of livestock.
However, there is no evidence that the proportion of human-edible raw materials has decreased over the 35-year period (Figure 1).
Indeed, the proportion of human-edible raw materials remained relatively constant at 0.53 over the period. The lowest edible proportion (0.49) was achieved between 1987 and 1990 when significant amounts of rice bran and maize gluten feed were imported into the country for a relatively short period and used as cereal grain substitutes.
Total cereal grain use decreased substantially from between 1976 and 1990. During the same period there were increases in the use of oilseeds and cereal co-products (Figure 2), illustrating that Great Britain’s animal feed industry was capable of making major changes in the balance of raw materials at that time, driven most likely by changes in supply and cost per tonne.
Although total cereal grain use was similar in 2011 to that in 1976 (Figure 2), there were major changes in the different species of cereal grains (Figure 3).
Thus the use of wheat grain doubled between 1976 and 2011 probably reflecting its availability and price relative to that of other cereal grains, especially maize, and also the increase in the population of broiler chickens (0.73 increase between 1984 and 2011 (22)).
Production of wheat in the United Kingdom increased rapidly from 4.7 million tonnes in 1976 to 14.9 mil- lion tonnes in 1984 (26). Since 1984 the production of wheat in the United Kingdom has remained relatively constant at about 15 million tonnes per annum, as has the proportion of domestic consumption used for animal feed (0.47, 22).
The lack of change in the use of beans and peas (Figure 2) probably reflected the increased popularity of oilseed rape as a break crop in cereal crop rotations and the relatively lower yields per hectare of pulse grains compared to other arable crops (22).
The area of land devoted to the production of oilseed rape in Great Britain in 1976 was 56,000 ha. (27).
By 1984, when rapeseed meal usage was first reported separately in the survey of animal feed mills, the area had expanded to 176,000 ha. (27).
In 2011 the area of oilseed rape was 705,000 ha. (22). Beans and peas can replace soyabean meal in nutritionally-balanced diets for pigs without adversely affecting growth rate, efficiency of feed conver-sion or carcase quality (28, 29) but the relatively high CFP tonne-1 of both beans and peas compared with that of soyabean meal (Table 2) means that their potential impact on the CFP of livestock production is likely to be lim- ited, as Topp et al. (11) and Leinonen et al. (12) found in life cycle analyses of pig and poultry systems, respectively.
Cereal co-product usage showed a modest increase in the late 1980s and early 1990s but there has been little change since 1994 (Figure 2).
This situation may change in the near future as distillers’ dried grains with solubles (DDGS) are produced in larger quantities from the production of bioethanol from wheat grain.
DDGS are expected to replace both wheat grain and soyabean meal in animal feeds, especially those for ruminants (30). The CFP of DDGS is intermediate between that of wheat grain and soyabean meal (Table 2) so the effect of its use is likely to be greater on the CFP of fuel production than on the CFP of animal feeds.
The use of soyabean meal apparently increased throughout the 35-year period, reflecting increased world production of soyabeans from 45 million tonnes in 1970 (31) to 265 million tonnes in 2010/11 (32) and the trend of increased annual importation of soyabean meal into Great Britain (Figure 5).
However, the proportion of soyabean meal in the total oilseed usage remained relatively constant, reflecting increased use of rapeseed meal, most likely in ruminant feeds.
Changes in livestock populations may help to explain, in part, the changes in the relative importance of raw materials. Increased use of both wheat grain and soyabean meal which are important components of the diet for poultry reared for meat (17), reflected large increase in poultry slaughterings (431 million in the UK in 1976 compared to 931 million in 2011, 22).
The values for the CFP of each raw material were derived recently and no attempt was made to make arbitrary adjustments in CFP for trends in crop yields, land use or land use change, so the CFP data for earlier decades should be treated with caution.
The overall trend of total annual raw material CFP (Figure 6) was broadly similar to that of the total annual quantity of raw materials used (Figure 1), suggesting that differences in the relative propor- tions of raw materials used over the period had little impact on CFP.
This is to be expected since differences in CFP between species of cereal grain, the main ingredient of animal feeds (Figure 2), are relatively small (Table 2).
Changes in the use of raw materials with relatively high CFP (e.g. peas, fish- meal) had little impact on total annual CFP since the quantities used were very low (Figure 2).
The marked increase of 2.75 Mt in total CFP between 1985 and 1994 – a 51% rise – reflected a similar increase in total raw material use which rose from 9.6 Mt in 1985 to 13.5 Mt in 1994 – a 41% rise, possibly reflecting greater demand for feed by integrated poultry units.
There may be conflicts between compound formulations based on least economic cost and those based on least environmental cost.
Garnsworthy and Wilkinson (33) found that constraining formulations to reduce environmental impact resulted in increased economic cost.
Thus soyabean meal was included in the lowest CFP con- centrate formulated for dairy cows yielding 40 litres of milk daily because of its relatively high nutrient density and relatively low unit cost of protein.
Concern over the use of soyabean meal for animal feeds relates to the relatively high CFP ascribed to it in some studies (e.g. 7690 g CO2e kg fresh weight-1 for Brazilian soyabean meal, 34), despite the fact that the crop is leguminous and requires no fertiliser nitrogen.
This high CFP is based on the assumption that all soyabean pro- duction is from recently deforested land. Much lower CFP for soyabean meal have been quoted in more recent -1 work (e.g. 954 g CO2e kg fresh weight Table 2) acknowledging that much soyabean production is on land which has been in arable cropping for more than 20 years and which has reached relative stability of soil carbon.
The latter value is still higher than the CFP of 684 g CO2e kg-1 for rapeseed meal and of 718 g CO e kg-1 for DDGS (Table 2), indicating that there may be some potential to reduce environmental impact by substituting soyabean meal with rapeseed meal or wheat DDGS with the added benefit of reducing the human-edible proportion of raw material use.
Assuming similar oil extraction rates the effect on land use would be slight despite the lower concentration of protein (400 g CP kg DM-1 for rapeseed meal compared to 503 g kg DM-1 for soyabean meal, 37), since the typical yield of winter oilseed rape in the UK is 3.2 tonnes hectare-1 compared to only 2.4 tonnes hectare-1 for soyabean seed production in America (3).
The CFP of concentrates and their raw materials are insignificant for ruminants in comparison with their emissions of methane and nitrous oxide.
However, the CFP of concentrates is very important for monogastrics (Table 1) and changes in the CFP of compounds made for them (e.g. less soyabean meal) are likely have a relatively bigger impact than changes in the composition of ruminant compounds.
The extent to which any mitigation may be realised depends on convinc- ing evidence that soyabean meal can be replaced in diets for pigs and poultry by alternative raw materials of lower CFP without affecting adversely biological or economic efficiency of conversion of feed into animal product.
Conclusions
Despite increases in the use of wheat and soyabean meal, there was little overall change between 1976 and 2011 in the proportion of human-edible raw materials in manufactured animal feeds in Great Britain because there were also increases in the use of inedible co-products such as rapeseed meal and, to a lesser extent, cereal co-products.
Changes with time in the balance of raw material use had relatively little impact on the overall CFP tonne-1 of feed.
The use of human-edible raw materials for animal feeds will come under greater scrutiny as the pressure to grow food crops for the human population increases in future years.
The challenge to animal feed industries is to make more effective use of human-inedible co-products and to reduce CFP tonne-1 by, for example, reduced use of soyabean meal and greater use of rapeseed meal and wheat DDGS in diets without compromising efficiency of conversion of feed into milk and meat.
The decreased use of cereal grains from 1976 to 1989 suggests that animal feed industries should be capable of adaption to changing circumstances if economic or political pressures are great enough.
With a rising world human population, demand for human-edible feeds such as cereal grains will increase and, if supply cannot meet demand, will most likely result in less being used in diets for livestock.
In the short-term, however, specific economic incentives may be required, underpinned by sound research evidence of their efficacy in diets for livestock, to achieve significant reductions in the use of human-edible feeds or in the CFP tonne-1 of manufactured compounds and blends for livestock.
Acknowledgements
The assistance of staff in the statistics group of DEFRA, York, is gratefully acknowledged.
References
1. BOCM PAULS. (2012) Our history. http://www.bocmpauls.co.uk/bocm-pauls- about-us-our-history Accessed 27 09 2012.
2. Williams, A G, Audsley, E & Sandars, D L, (2006) Determining the environmental burdens and resource use in the production of agricultural and horticultural commodities. Main Report. Defra Research Project IS0205. Cranfield University, Bedford, UK. 97p. http://randd.defra.gov.uk/ Accessed 24 10 2012.
3. Wilkinson, J M & Audsley, E (2013) Options from life-cycle analysis for reducing greenhouse gas emissions from crop and livestock production systems. International Journal of Agricultural Management, 2, 70-80.
4. Vellinga, Th V, Blonk, H, Marinussen, M, van Zeist, W J & de Boer, I J M (2012) Methodology used in feedprint: A tool quantifying greenhouse gas emissions of feed pro- duction and utilization. Wageningen UP Livestock Research, Lelystad, The Netherlands. http://www.fao.org/fileadmin/user_upload/ben chmarking/docs/vellinga_feedprin_project.pdf and http://webapplicaties.wur.nl/software/feed- print/ Accessed 23 10 2012.
5. Pelletier, N, Pirog, R & Rasmussen, R 2010. Comparative life cycle environmental impacts of three beef production strategies in the Upper Midwestern United States. Agricultural Systems, 103, 380-389.
6. Wilkinson, J M. (2011) Re-defining efficiency of feed use by livestock. Animal 5, 1014-1022.
7. Godfray, HC J, Beddington, JR, Crute, I R, Haddad, L, Lawrence, D, Muir, J F, Pretty, J, Robinson, S, Thomas, S & Toulmin, C (2010) Food security: The challenge of feeding 9 bil- lion people. Science. 327: 812-818.
8. Garnett, T (2009) Livestock-related greenhouse gas emissions: Impacts and options for policy makers. Environmental Science and Policy, 12, 491-503.
9. Council for Agricultural Science and Technology (CAST), (1999) Animal Agriculture and Global Food Supply. Task Force Report No. 135, July 1999. CAST, Ames, IA, USA. 92p.
10. Erb, K-H, Mayer, A, Kastner, T, Sallet, K-E & Haberl, H (2012) The Impact of Industrial Grain-Fed Livestock Production on Food Security: An extended literature review. Commissioned by Compassion in World Farming, The Tubney Charitable Trust and World Society for the Protection of Animals, UK. Vienna, Austria. 83 p.
11. Topp, C F E, Houdijk, J G M, Tarsitano, D, Tolkamp, B J & Kyriasakis, I (2012) Quantifying the environmental benefits of using home grown protein sources as alternatives to soyabean meal in pig production through life cycle assessment. Advances in Animal Biosciences 3 (1), 15.
12. Leinonen, I, Williams, A G, Waller, A & Kyriazakis, I (2013) The potential of reducing the environmental impacts of poultry systems through the inclusion of alternative protein crops in the diet. Agricultural Systems (Submitted).
13. Government Statistical Service (1977 to 1991) Ministry of Agriculture Fisheries and Food. Production of compounds and other processed animal feedstuffs in Great Britain and usage of raw materials. Statistical Information STATS 139/77 to 146/91.
14. Johnson, T. (2012) Personal communication.
15. DEFRA (2012a) Retail production of animal feedstuffs in Great Britain. http://www.defra.gov.uk/statistics/foodfarm/fo od/animalfeed/ Accessed 25 09 2012.
16. DEFRA (2012b) Integrated poultry feed production – dataset. http://www.defra.gov.uk/statistics/foodfarm/fo od/animalfeed/ Accessed 25 09 20122
17. Leinonen, I, Williams, A.G, Wiseman, J. Guy, J & Kyriazakis, I (2012a) Predicting the environmental impacts of poultry systems through a life cycle assessment: Broiler production systems. Poultry Science, 91, 8-25.
18. Leinonen, I, Williams, A.G, Wiseman, J, Guy, J & Kyriazakis, I (2012b) Predicting the environmental impacts of poultry systems through a life cycle assessment: Egg production systems. Poultry Science, 91, 26-40.
19. The National Archives (2012) Statistics of Trade Act, 1947. http://www.legislation.gov.uk/ukpga/Geo6/10- 11/39 Accessed 11 10 2012.
20. DEFRA (2012c) Archive: BSE: Disease control & eradication – The feed ban. http://archive.defra.gov.uk/foodfarm/farmani- mal/diseases/atoz/bse/controls- eradication/feed-ban.htm Accessed 24 10 2012.
21. Gardiner, J. (2012) Personal communication.
22. DEFRA (2012d) Agriculture in the United Kingdom. http://www.defra.gov.uk/statistics/foodfarm/cr oss-cutting/auk/ Accessed 25 09 2012
23. Keenan, G. (2012) Personal communication.
24. McDonnell, P, Wray, A E & Wilkinson, J M (2012) Statistical indicators of livestock efficiency related to greenhouse gas emissions. Advances in Animal Biosciences, 3: 16.
25. DEFRA (2012e) Agricultural Statistics and Climate Change, 3rd Edition, July 2012. http://www.defra.gov.uk/statistics/foodfarm/en viro/climate/ Accessed 28 09 2012
26. UK Agriculture (2012) Long term trends for cereal crops over the past 100 years. http://www.ukagriculture.com/farming_today/l ong_term_yields.cfm Accessed 23 10 2012.
27. Brassley, P (2000) Output and technical change in twentieth century British agriculture. The Agricultural History Review 48, 60-84.
28. White, G, Wiseman, J, Smith, L A, Houdijk, J G M. & Kyriazakis, I (2012a) Nutritional value of diets for growing/finishing pigs con- taining high levels of home grown legumes compared with one based on soyabean meal. 1. Growth performance. Advances in Animal Biosciences, 3, 52.
29. White, G, Smith, L A. Homer, D, Wiseman, J, Houdik, J G M. & Kyriazakis, I (2012b). Nutritional value of diets for growing/finishing pigs containing high levels of hole grown legumes compared with one based on soyabean meal. 2. Carcass quality. Advances in Animal Biosciences, 3, 24.
30. Hazzeldine, M, Pine, A, Mackinson, I, Ratcliffe, J & Salmon, L (2011) Estimating dis- placement ratios of wheat DDGS in animal feed rations in Great Britain. Working Paper 2011-8, International Council on Clean Transportation, Brussels, November 2011, 19pp.
31. Vohra, P & Krazter, F H (1991) Evaluation of soybean meal determines adequacy of heat treatment. http://www.asaim- europe.org/backup/pdf/evaluation.pdf Accessed 11 10 2012.
32. United States Department of Agriculture (USDA) (2012) Foreign Agricultural Service. Table 11. Soyabean area, yield and production. http://www.fas.usda.gov/psdonline/circulars/pr oduction.pdf Accessed 11 10 2012.
33. Garnsworthy, P C & Wilkinson, J M (2012) Ration formulation for dairy cows: least cost versus least environmental impact. In: P C Garnsworthy & J Wiseman (eds) Recent Advances in Animal Nutrition 2012. Nottingham University Press, pp 95-113.
34. Gerber, P, Vellinga, Th, Opio, C, Henderson, B & Steinfeld, H (2010) Greenhouse Gas Emissions from the Dairy Sector: A Life Cycle Assessment. Food and Agriculture Organisation of the United Nations, Rome, Italy, 94p.
35. Nix, J (2011) Farm Management Pocketbook, 42nd Edition (2012). Agro Business Consultants Ltd, Melton Mowbray, UK, 283pp.
36. Williams, AG. (2012) Personal communication.
37. Thomas, C. (Ed.) 2004. Feed into Milk. A New Applied Feeding System for Dairy Cows. Feed Database. Nottingham University Press, Nottingham, UK.
Download pdfFigures
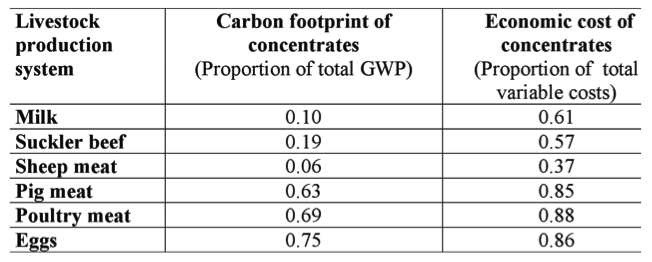
Table 1 Concentrate feeds as proportions of the total global warming potential (GWP) and total variable costs of different livestock produc- tion systems. (25, 35, 36)
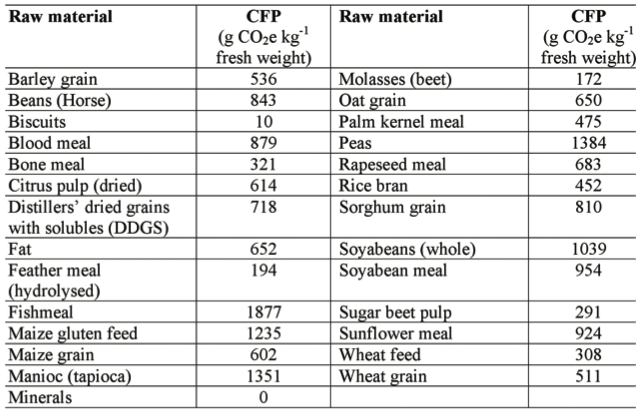
Table 2 Carbon footprint (CFP, gCO2e kg-1 fresh weight) of raw materials. (4)
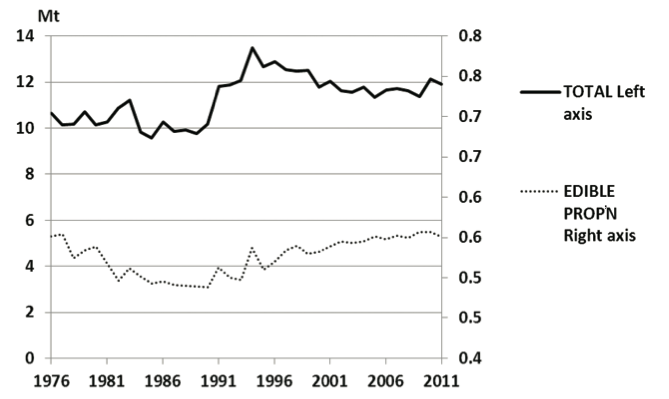
Figure 1: Total annual use (Million tonnes, Mt) of raw material animal feeds in the manufacture of compounded and blended animal feeds and estimated human-edible proportion, Great Britain, 1976 to 2011.
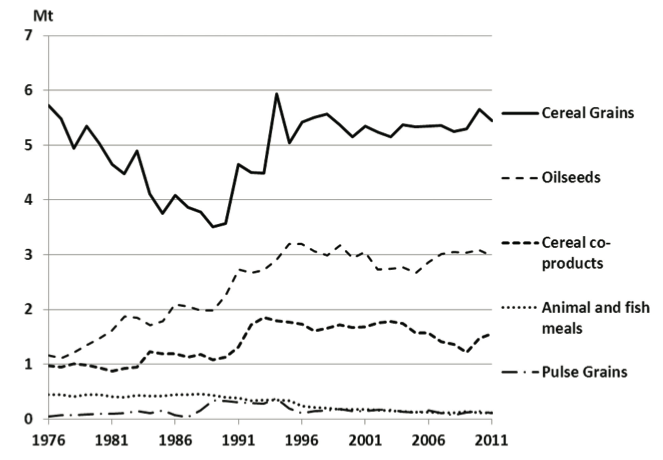
Figure 2. Annual use (Million tonnes, Mt) of cereal and pulse grains, oilseeds, cereal co-products and animal and fish meals in the produc- tion of compounded and blended animal feeds in Great Britain, 1976 to 2011.
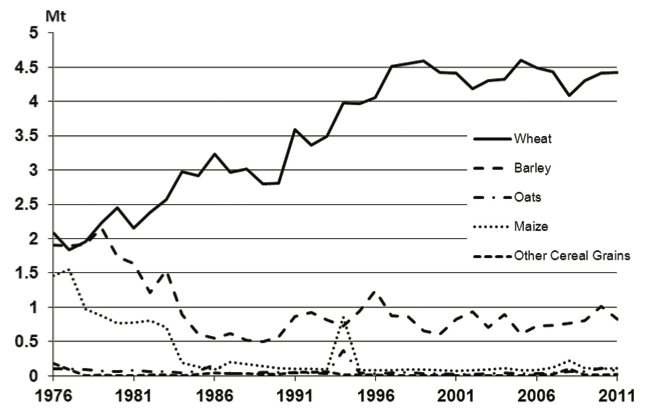
Figure 3. Annual use (Million tonnes, Mt) of different species of cereal grain in the manufacture of compounded and blended animal feeds, Great Britain, 1976 to 2011.
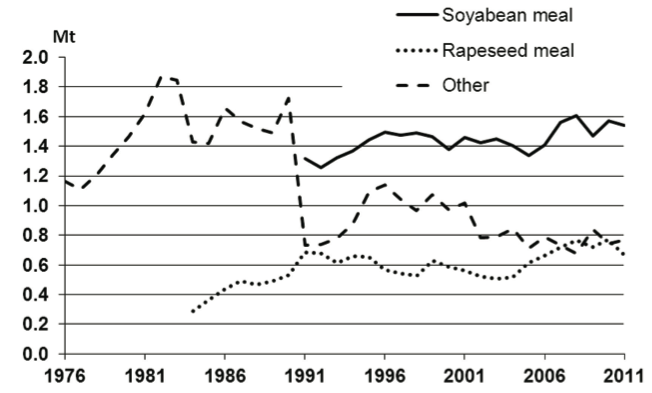
Figure 4. Annual use (Million tonnes, Mt) of oilseed co-products in the production of compounded and blended animal feeds, Great Britain, 1976 to 2011.
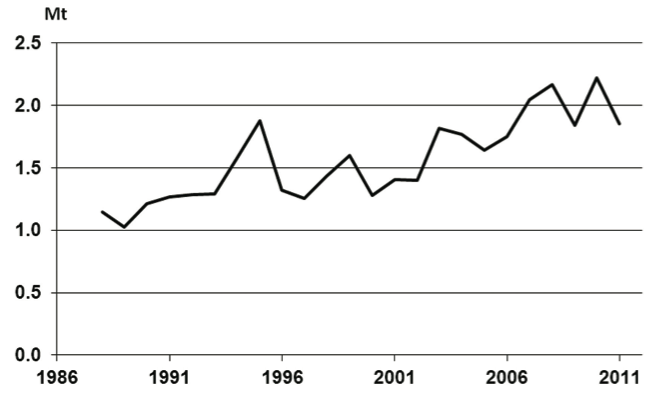
Figure 5. Annual quantities (Million tonnes, Mt) of soyabean meal imported into Great Britain, 1988 to 2011.
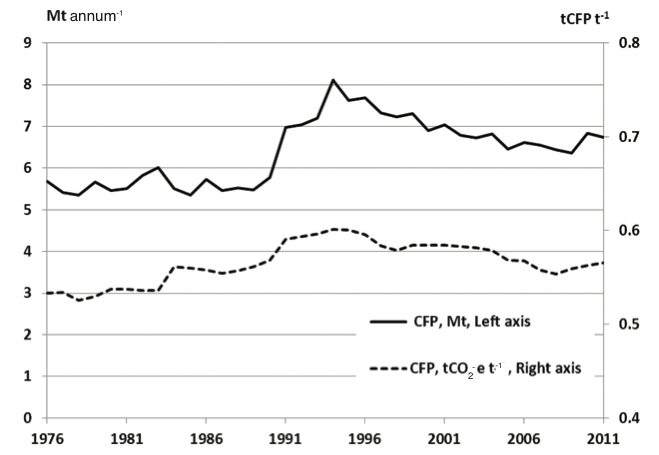
Figure 6. Carbon footprint (CFP, million tonnes (Mt) CO2e annum-1, left axis) and CFPt-1 (tonnes CO2e t-1, right axis) of raw materials used in the production of compounded and blended animal feeds, Great Britain, 1976 to 2011.